Marketing Reporting Platform
At Ask Media Group, I designed a unified marketing reporting platform that cut manual data aggregation by 2 hours daily and enabled marketers to manage 15% more campaigns—streamlining workflows and improving efficiency.
- Role
- UX Designer
- Team
- 1 UX Designer · 1 Product Manager · 2 Front-End Developers · 4 Back-End Developers
- Responsibilities
- Product Research · User Research · Wireframing · Prototyping
- Tools
- Figma · Zoom · Ant Design System
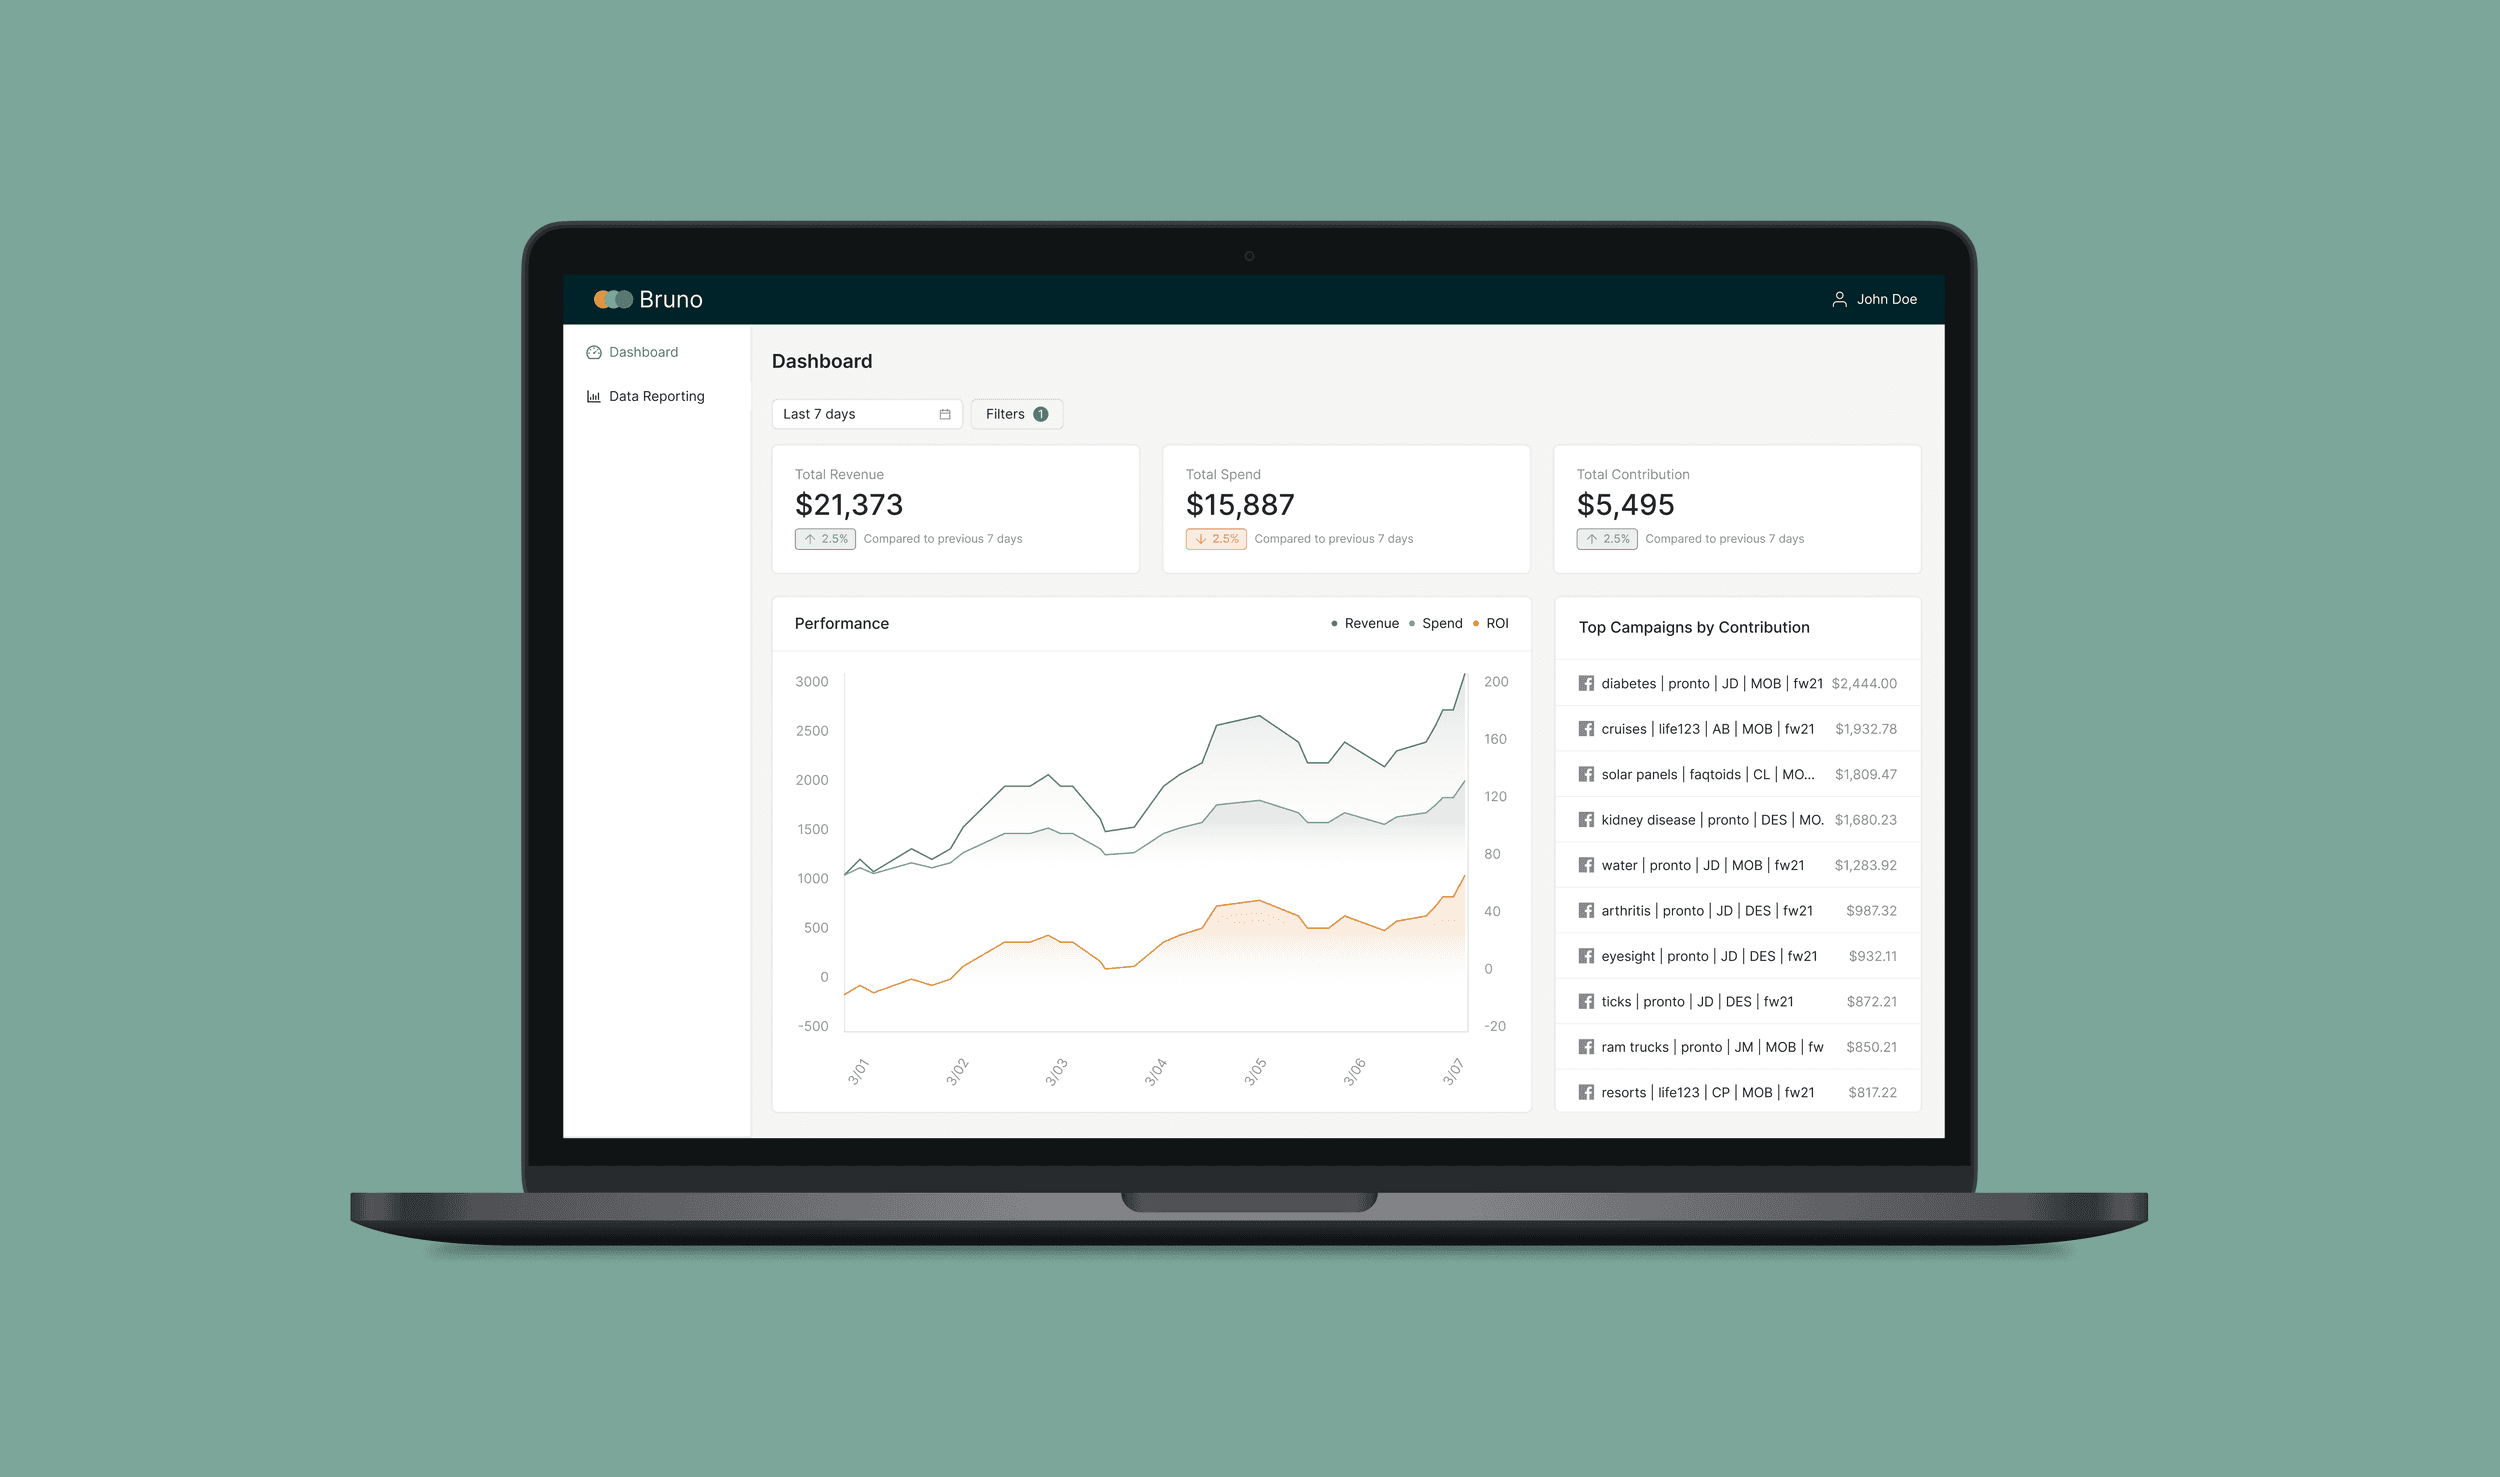
Overview
The Problem
Marketers were spending nearly two hours each day pulling spreadsheets and merging metrics just to understand what was working. That time loss wasn’t just frustrating and tedious—it was slowing campaign growth.
The Goal
Create a centralized platform to automate data aggregation, surface insights quickly, and improve campaign management efficiency.
01 — Understanding the User
I started the project by speaking with several marketers and managers to better understand the problems they were facing. They walked me through their reporting workflows and the tools, tabs, and spreadsheets they were juggling daily.
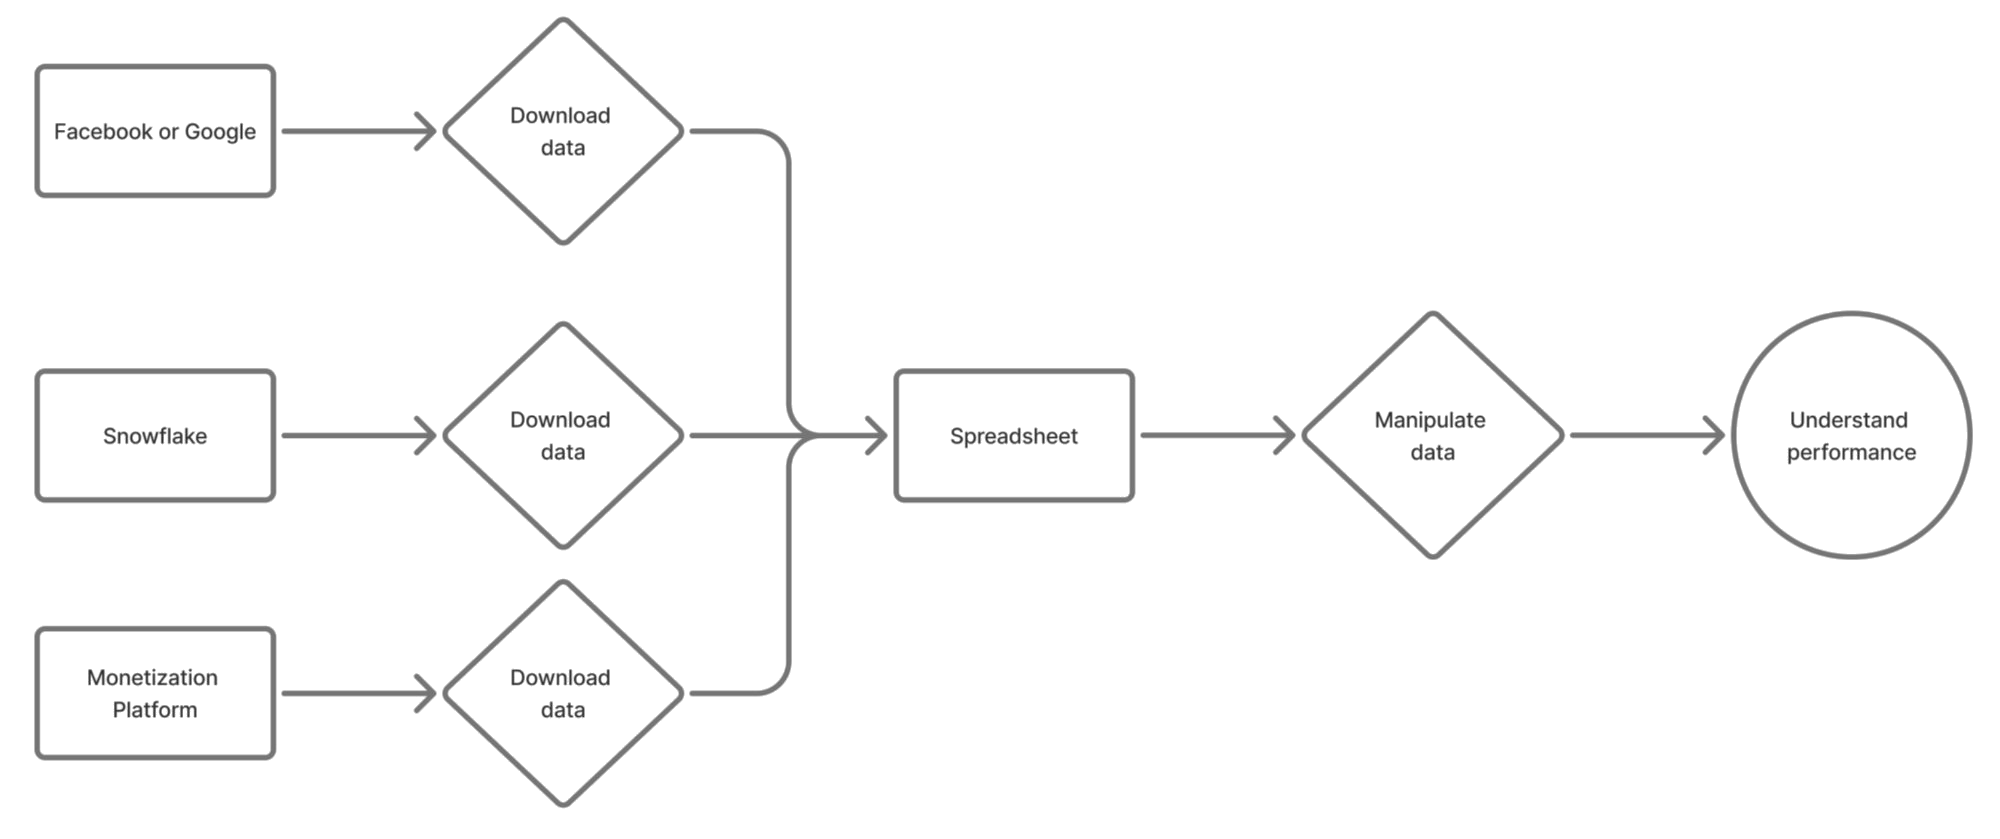
User Pain Points
Time-Consuming Processes
Manual data collection was tedious and inefficient.
Disparate Data
Metrics were scattered across platforms, making it hard to get a unified view.
Need for Custom Reports
Marketers wanted flexibility in reporting, including metrics and filters.
Lack of High-Level Insights
Data was difficult to interpret quickly using spreadsheets.
User Personas
Marketer
Daniel
Context
Manages hundreds of campaigns and spends too much of his day manually pulling and piecing together data.
Core Need
A reporting tool that reduces time on aggregation, allowing him to focus on strategy—not spreadsheets.
Team Manager
Mary
Context
Oversees a team of 12. Reviews inconsistent reports to piece together a high-level view of team performance.
Core Need
A platform that automates aggregation to monitor performance efficiently and make faster management decisions.
02 — Starting the Design
User research provided valuable insights that shaped the platform’s functionality and guided the design approach.
Design Goals
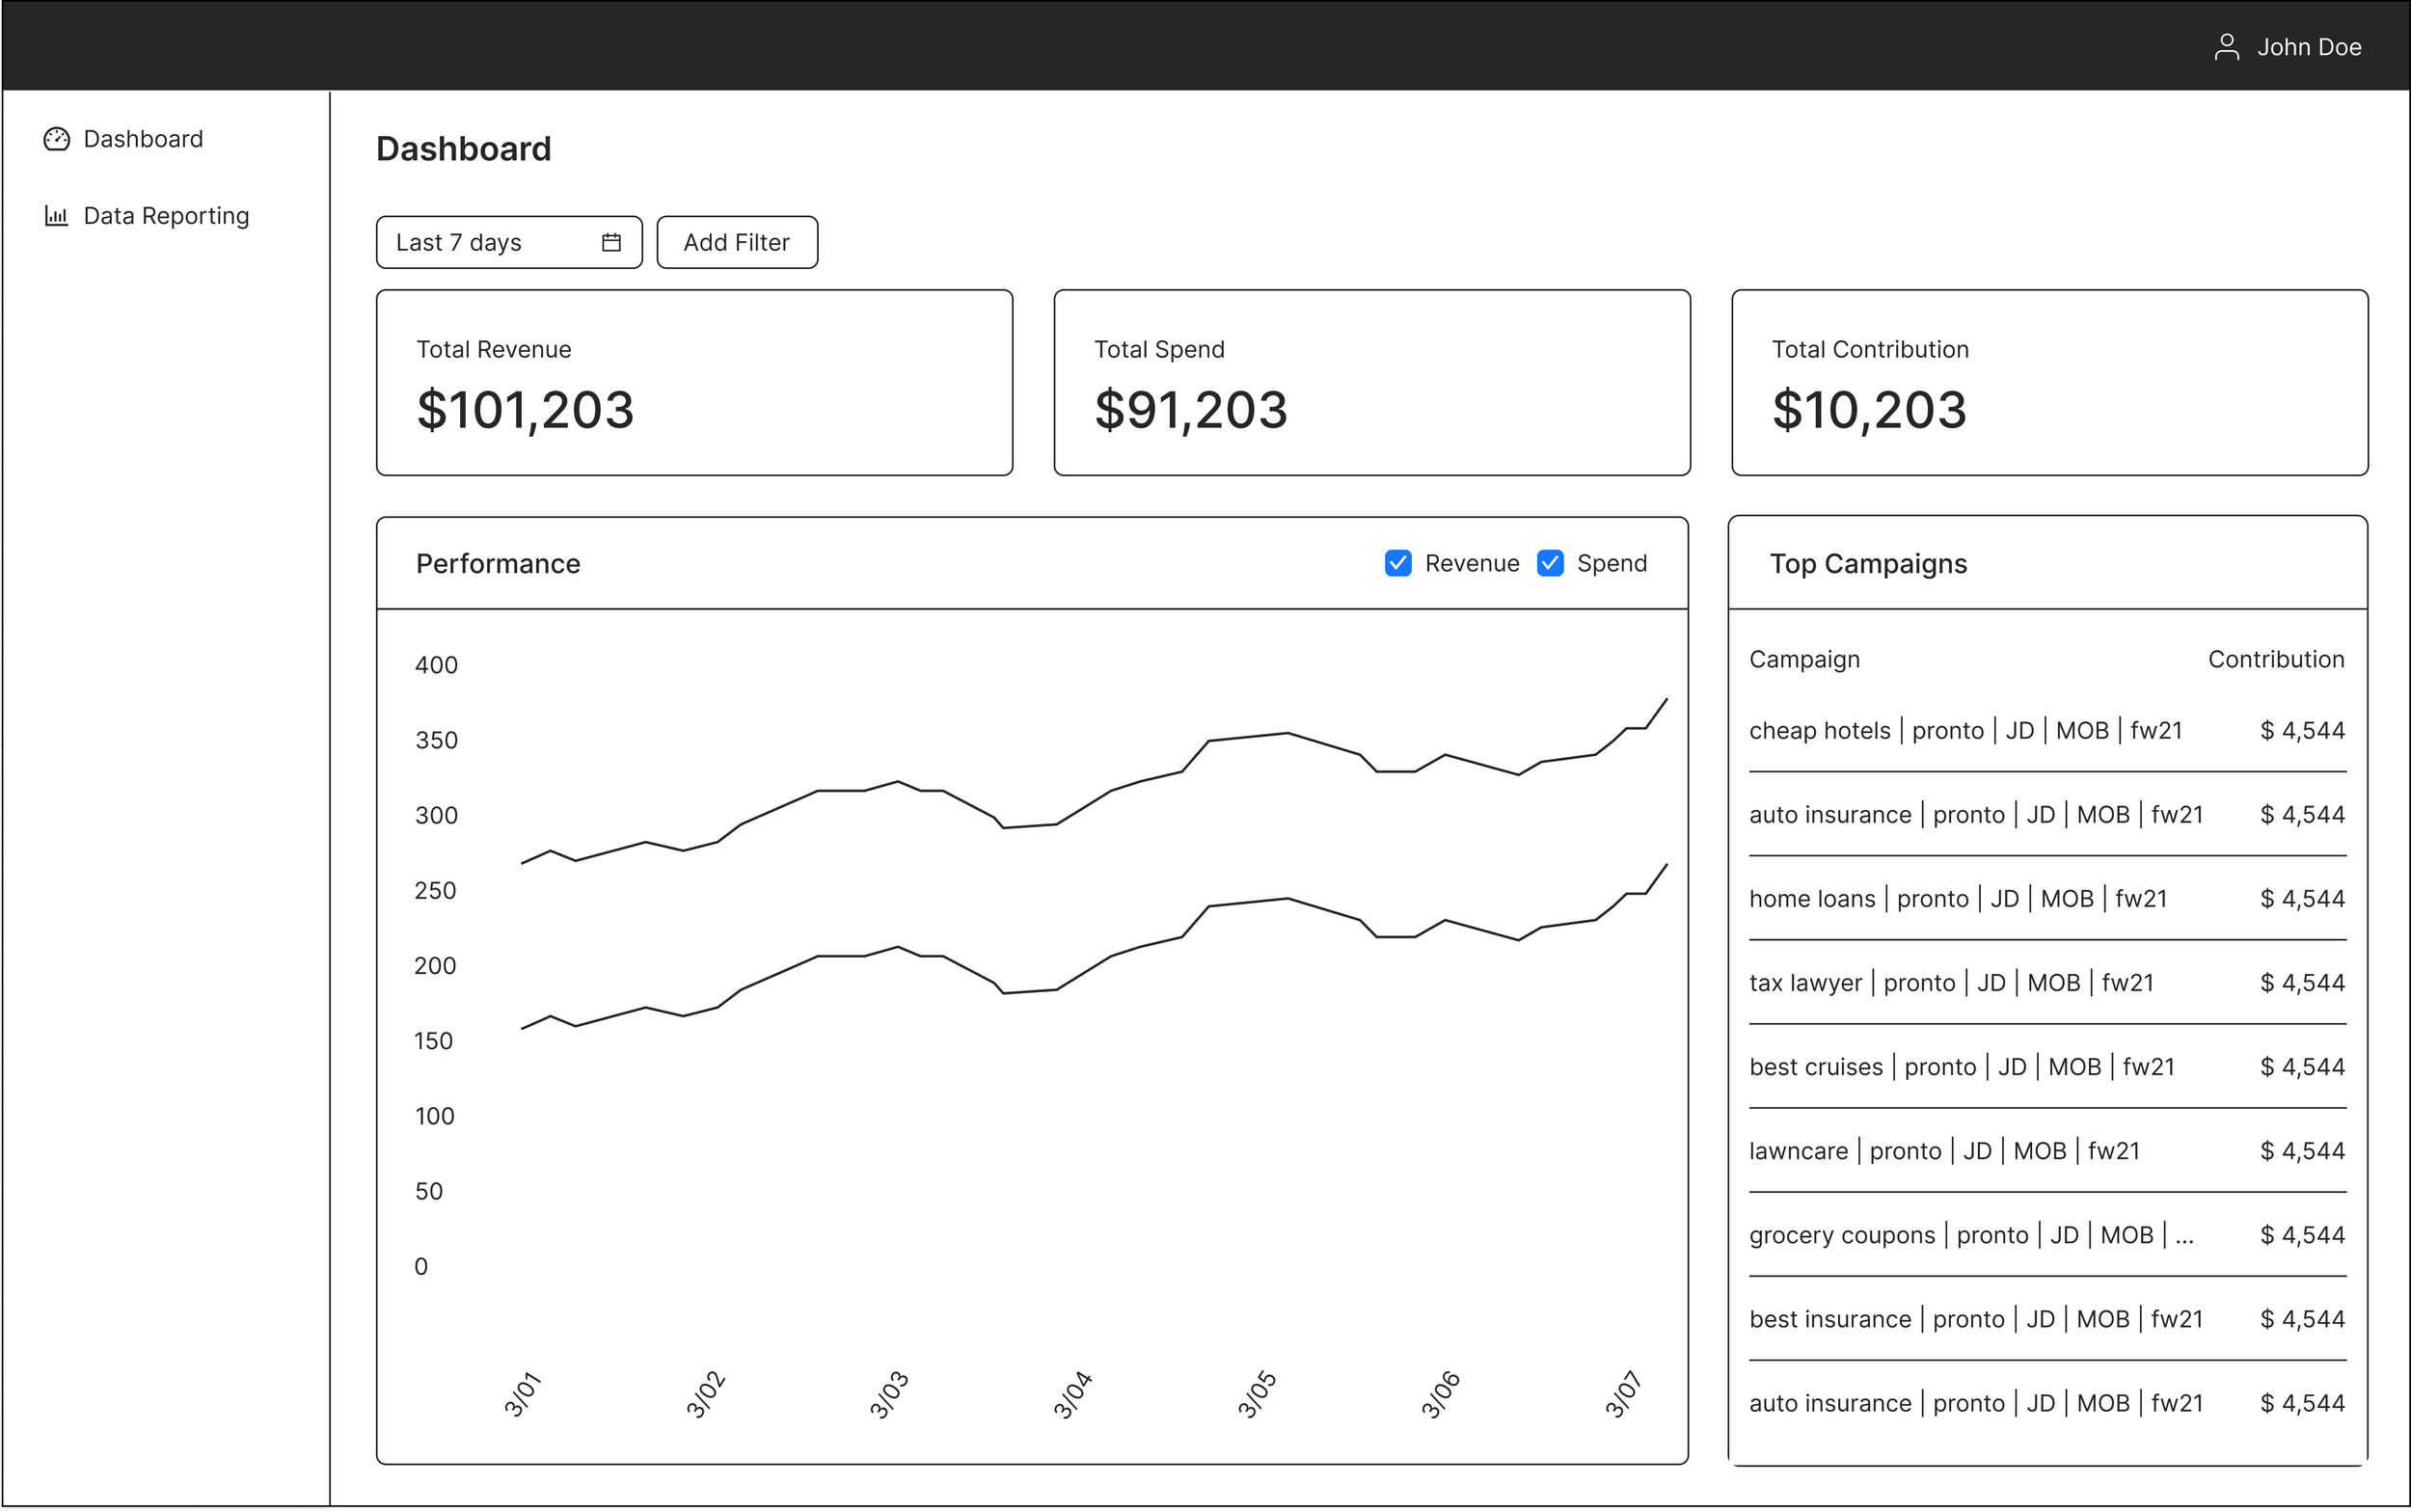
High-Level Performance Overview
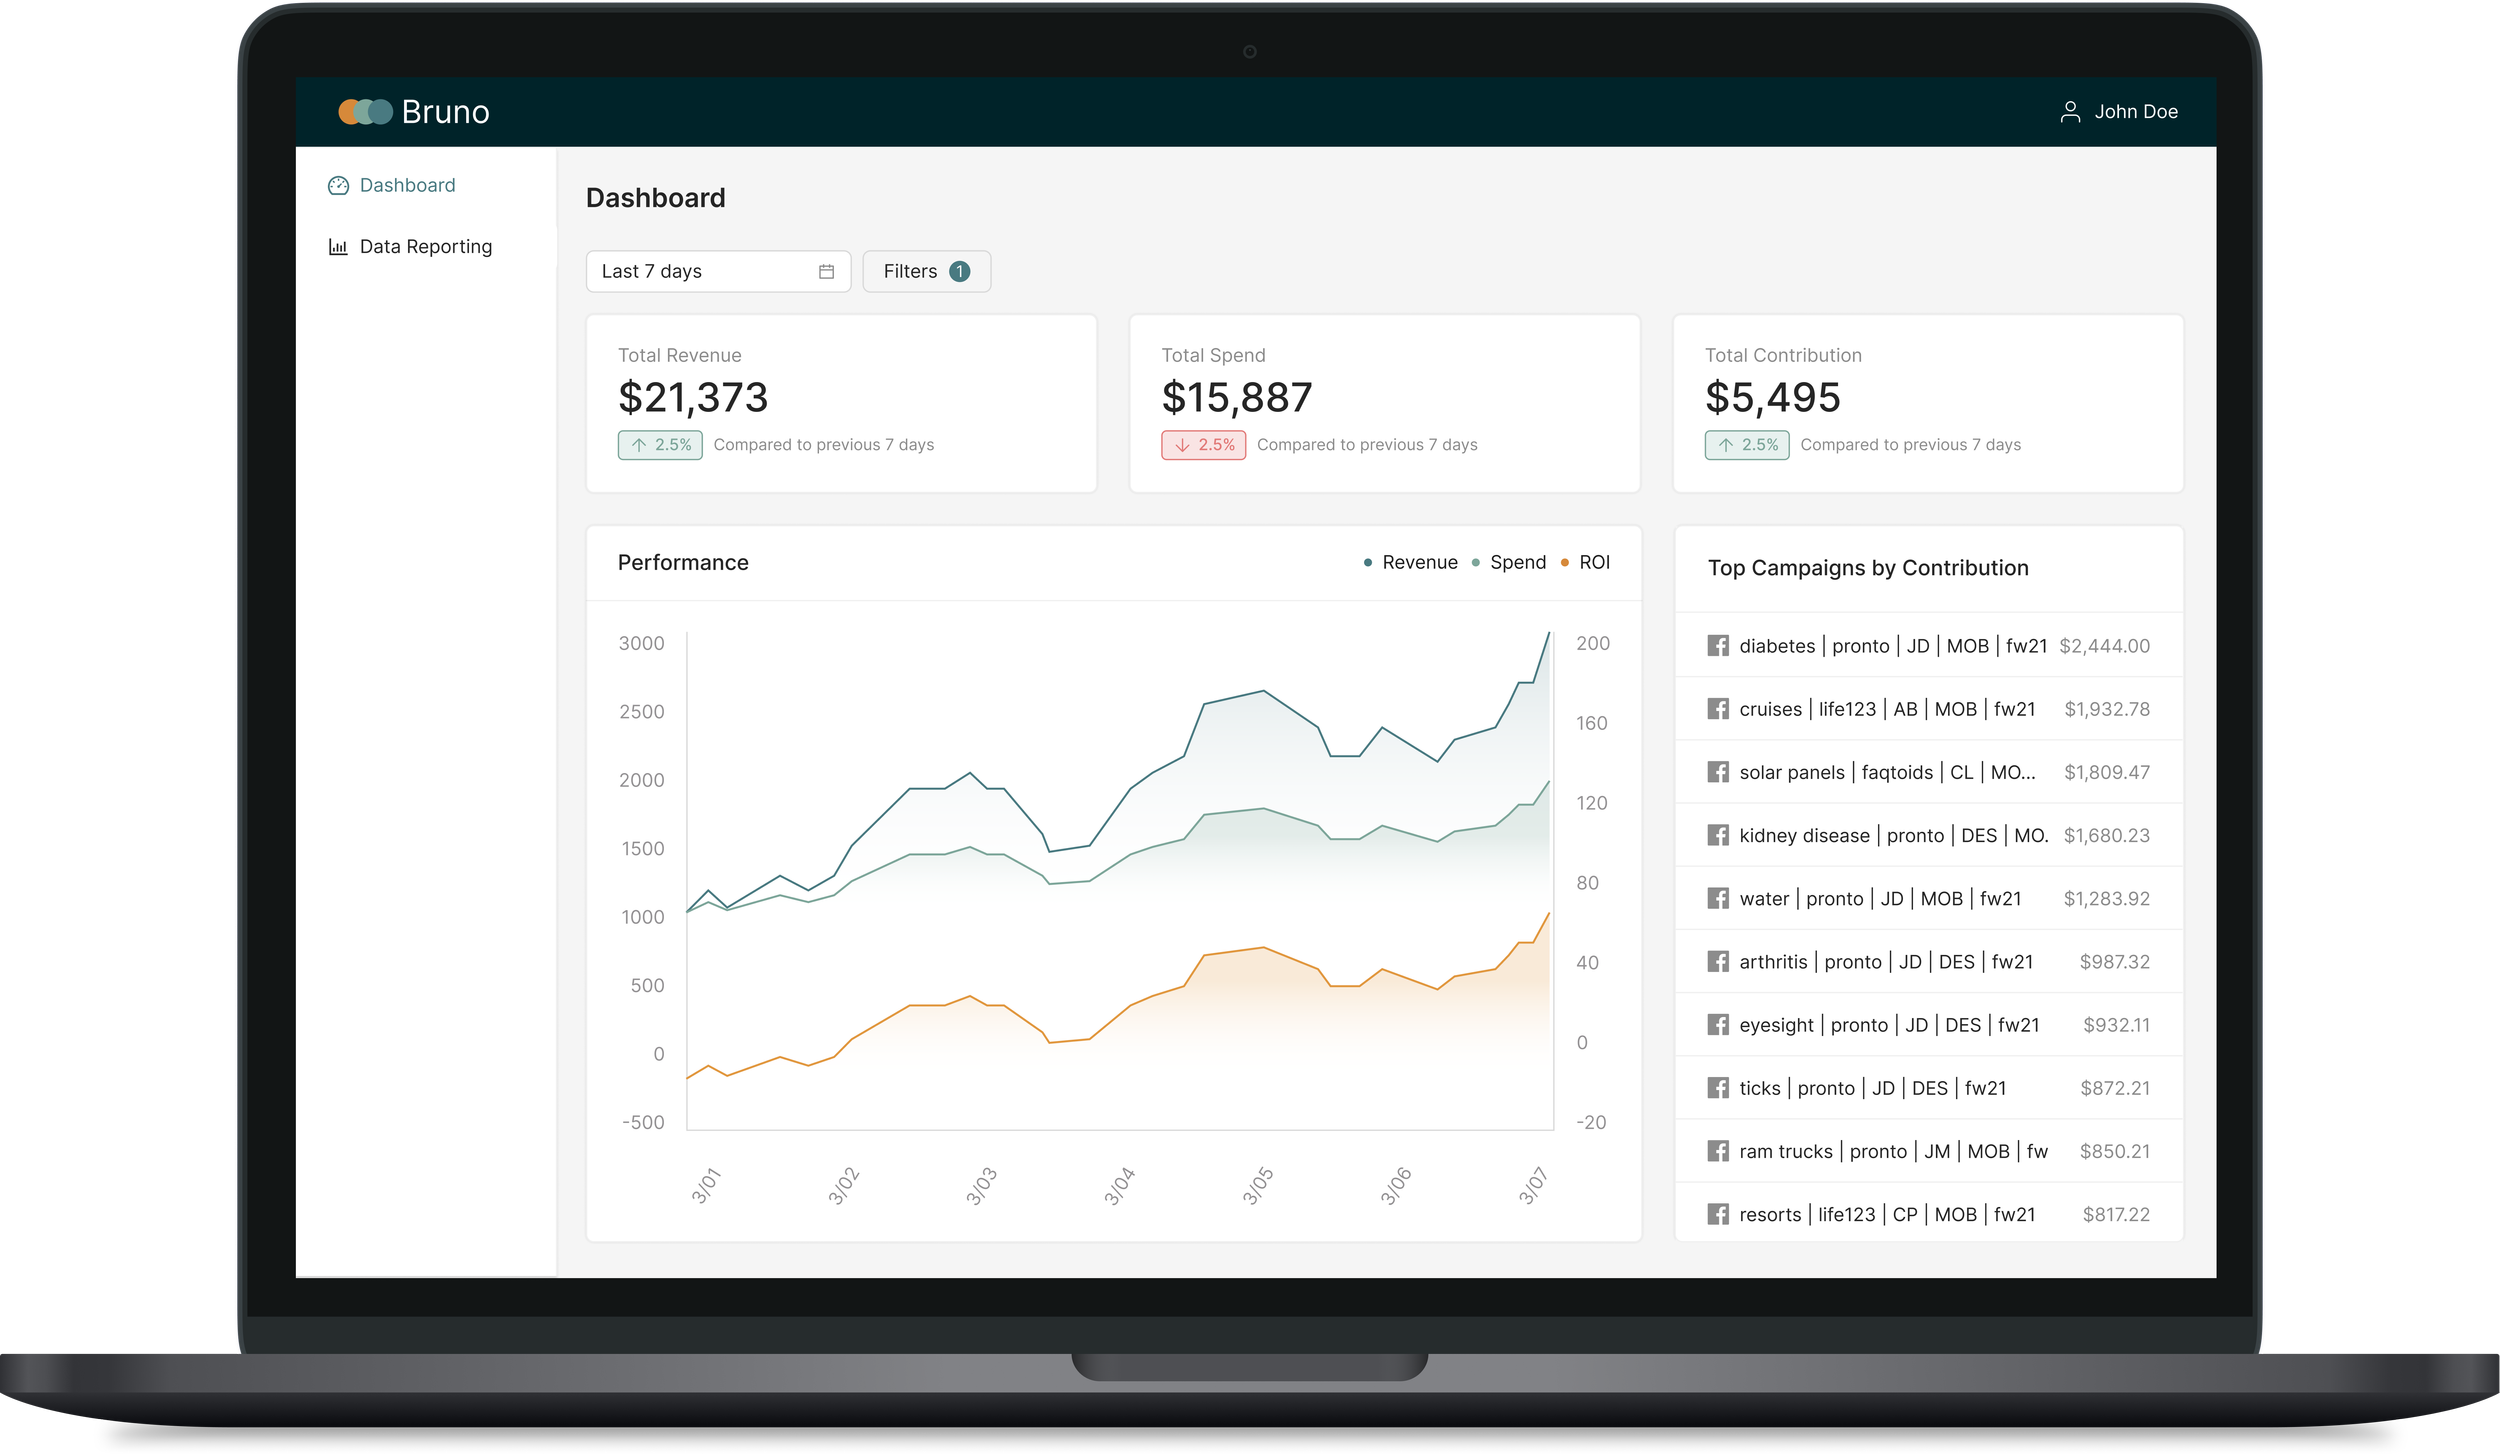
A dashboard for quick insights to identify which campaigns need attention.
Integrated Reporting
Consolidate buy and sell-side data into a single view.
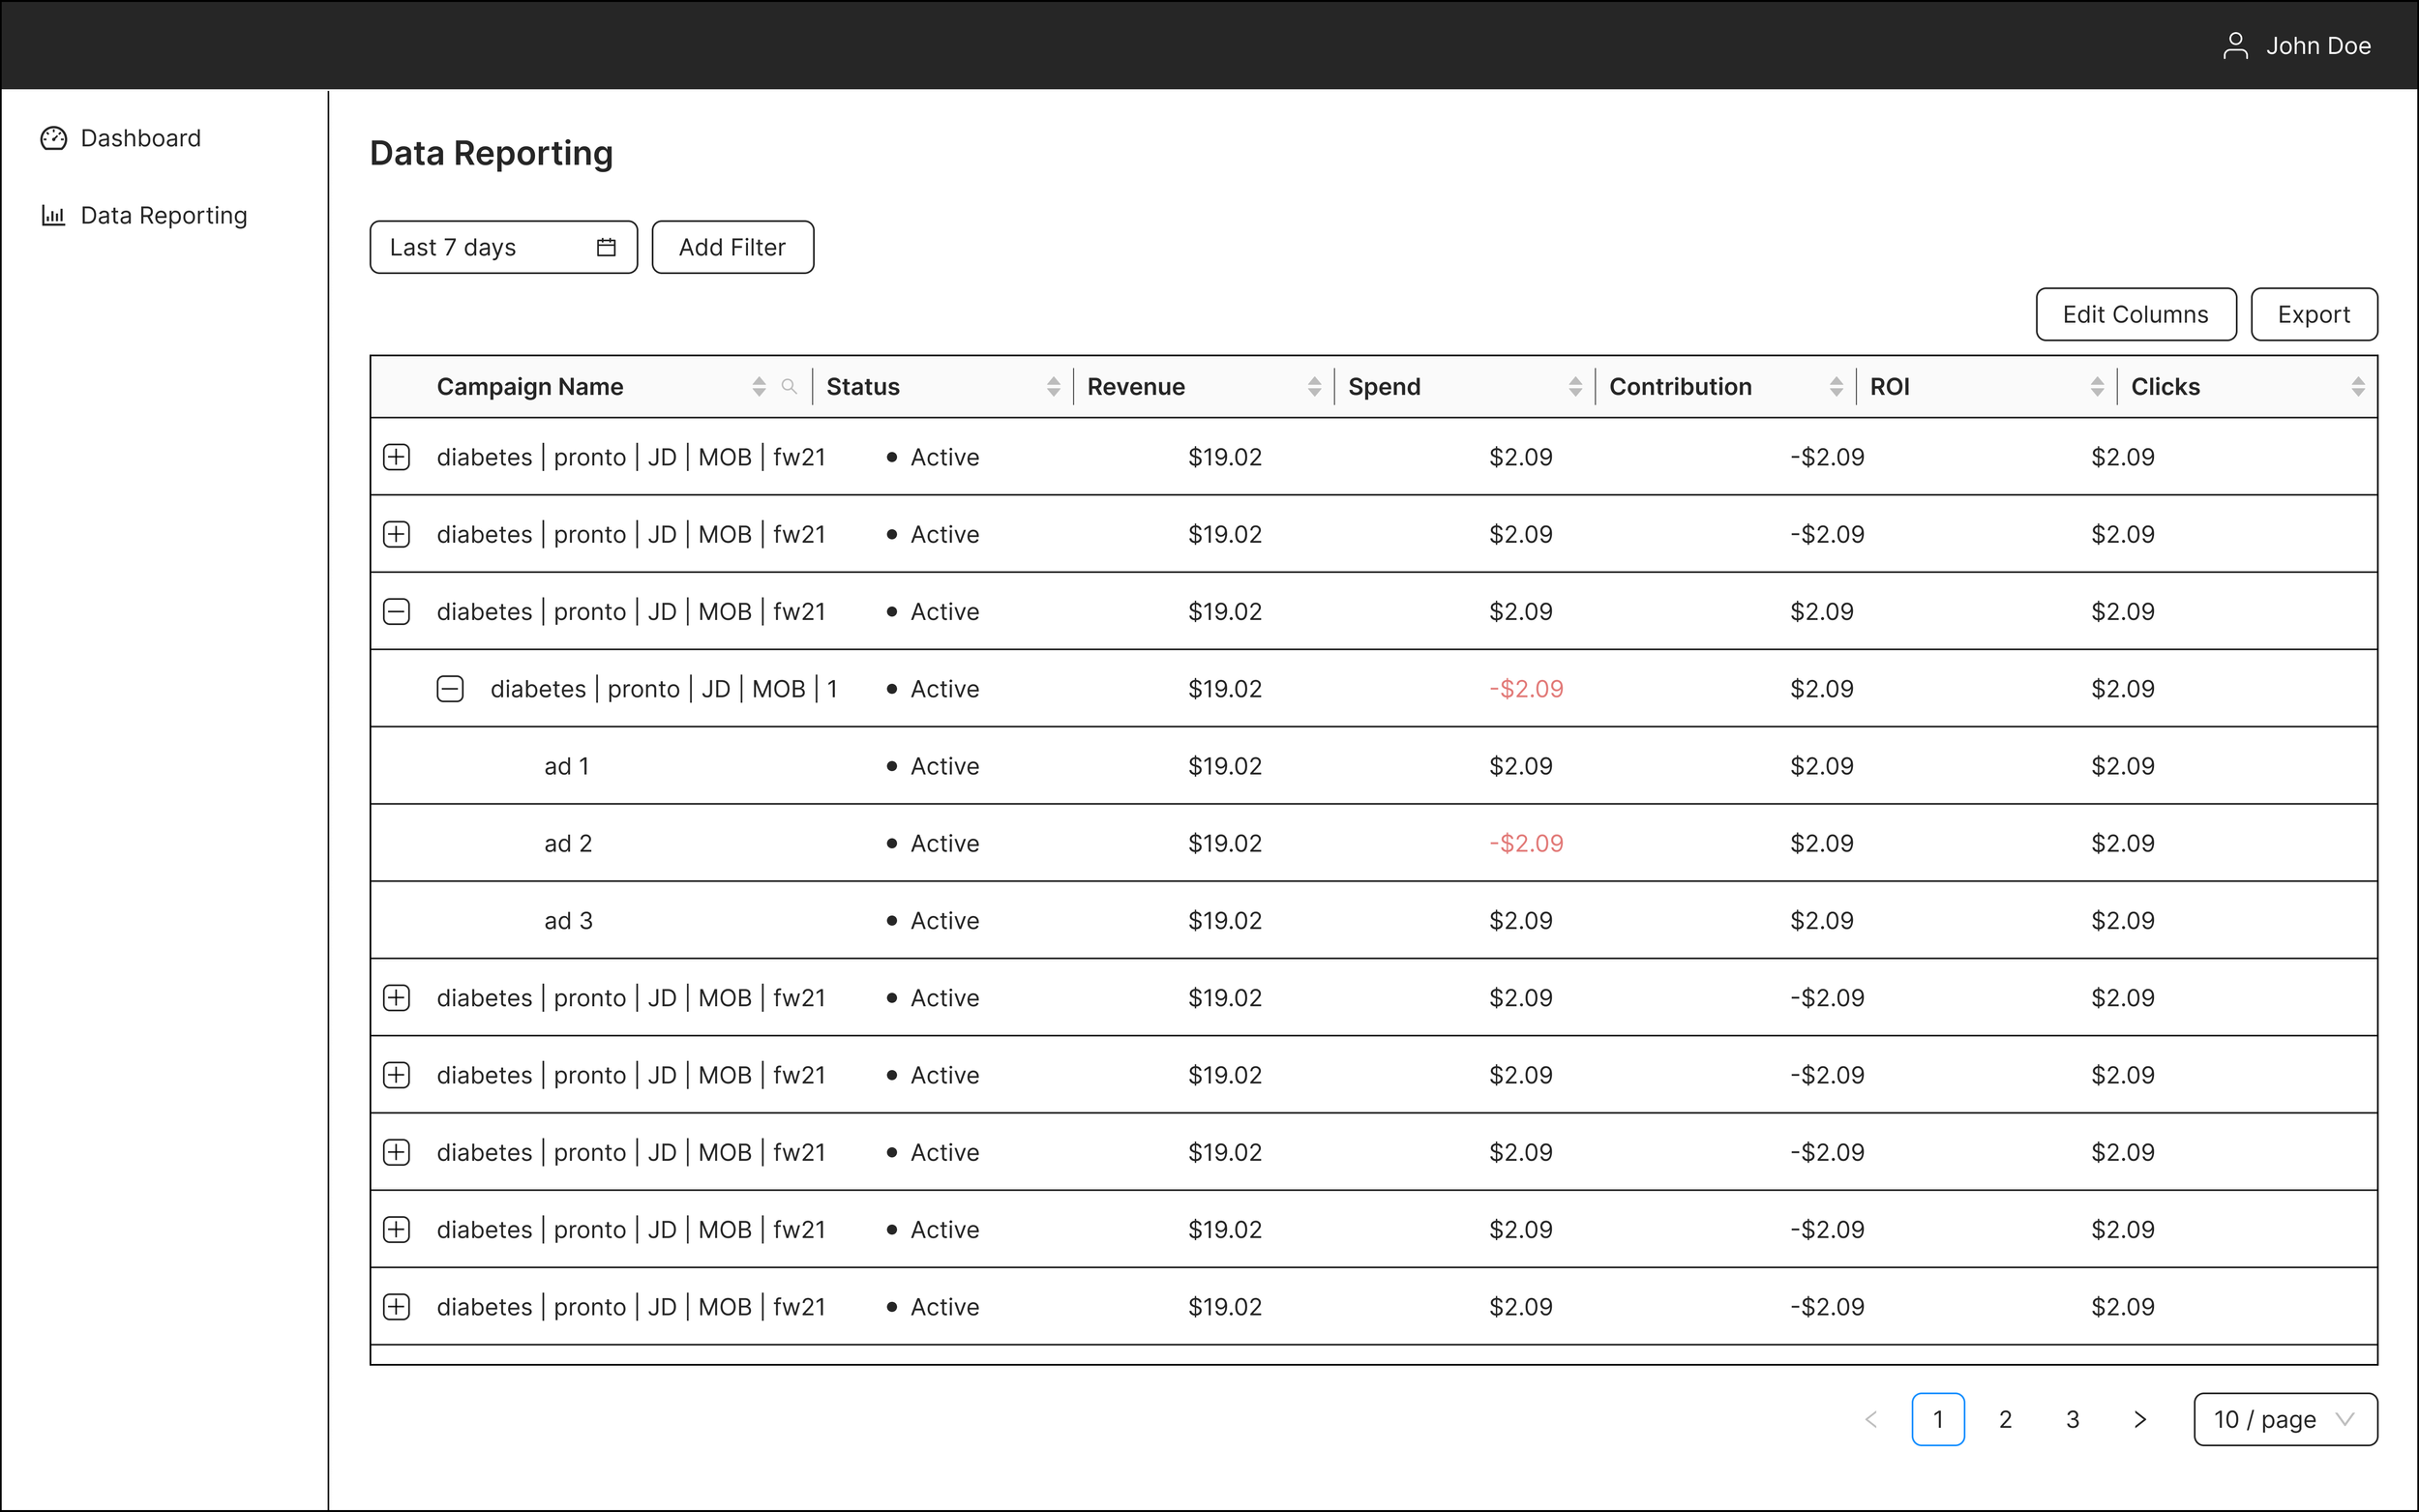
Customizable Reports
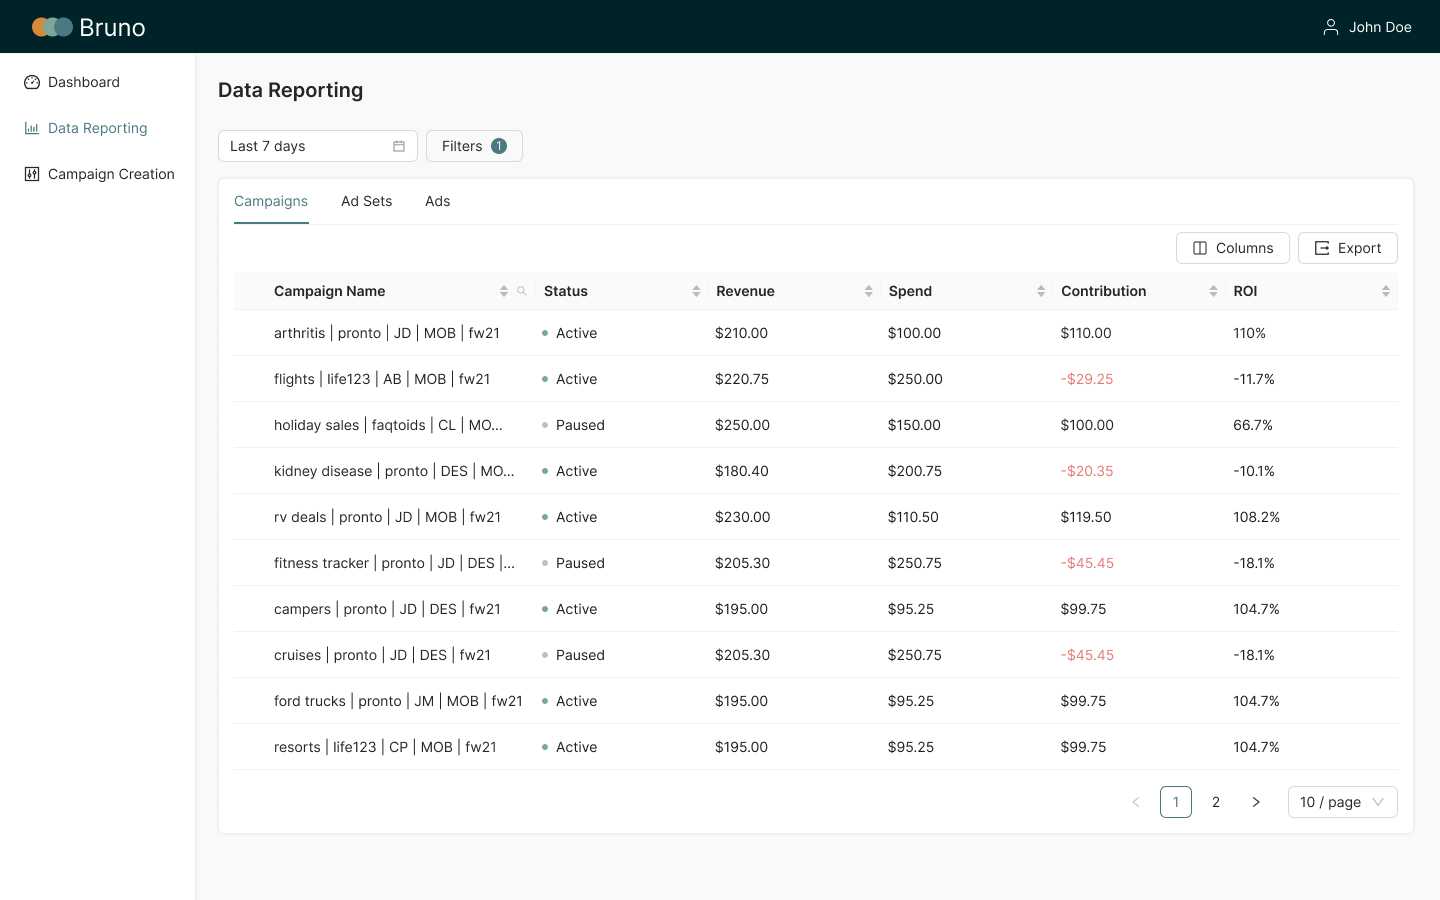
Allow users to filter data by date range, ad account, marketer, and keyword.
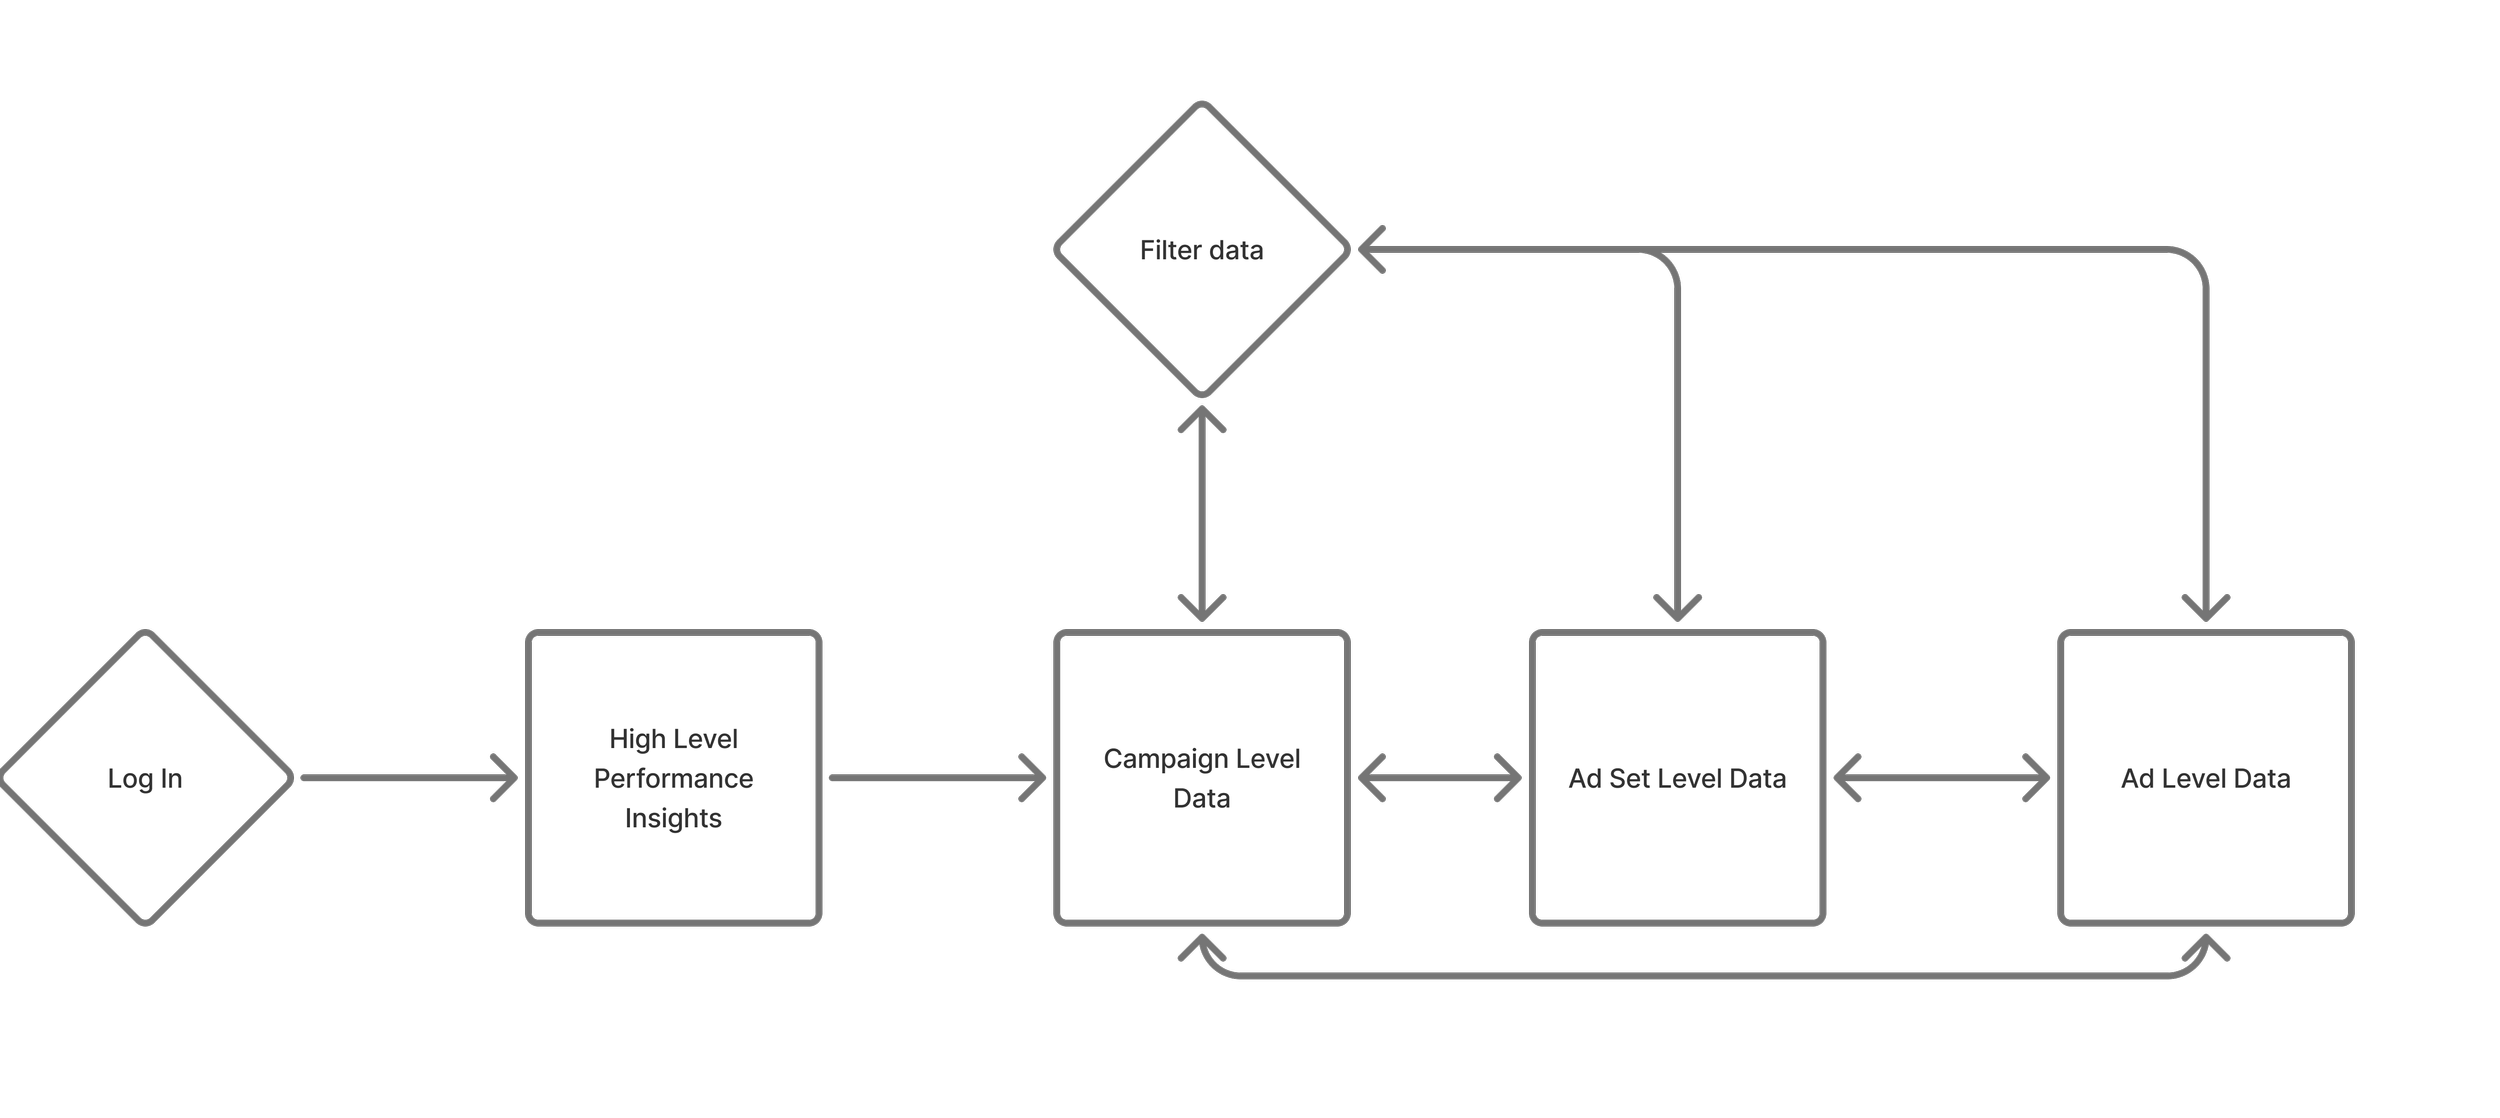
User Flow
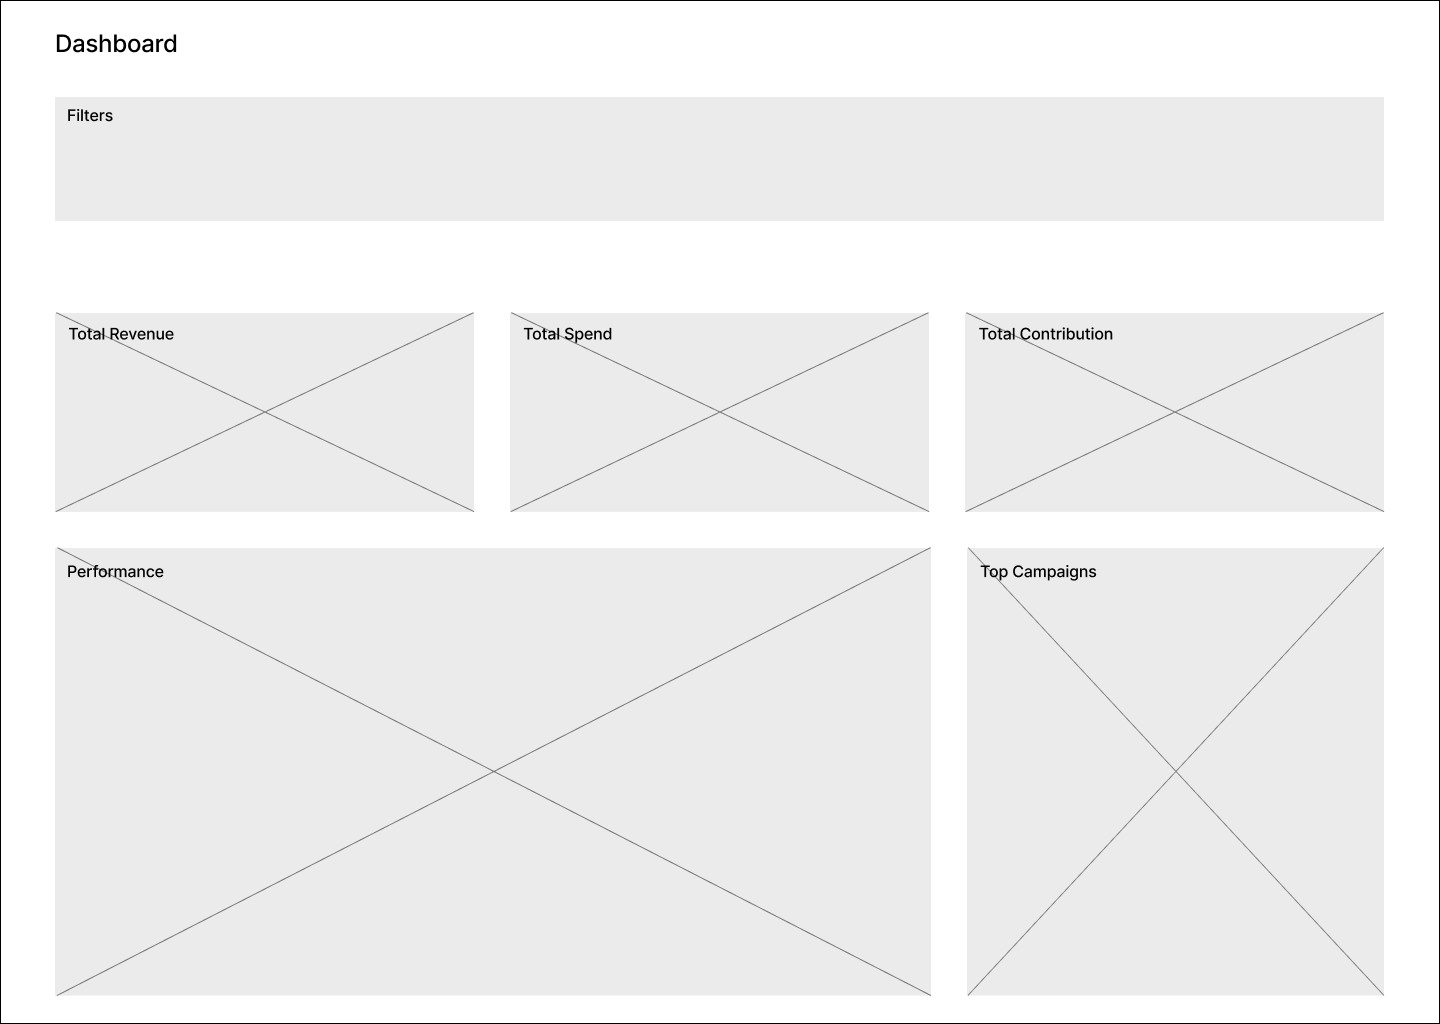
The redesigned flow moved marketers from a fragmented spreadsheet process into a two-page platform: a dashboard for high-level performance, then a reporting view for deeper analysis.
Exploring Early Concepts
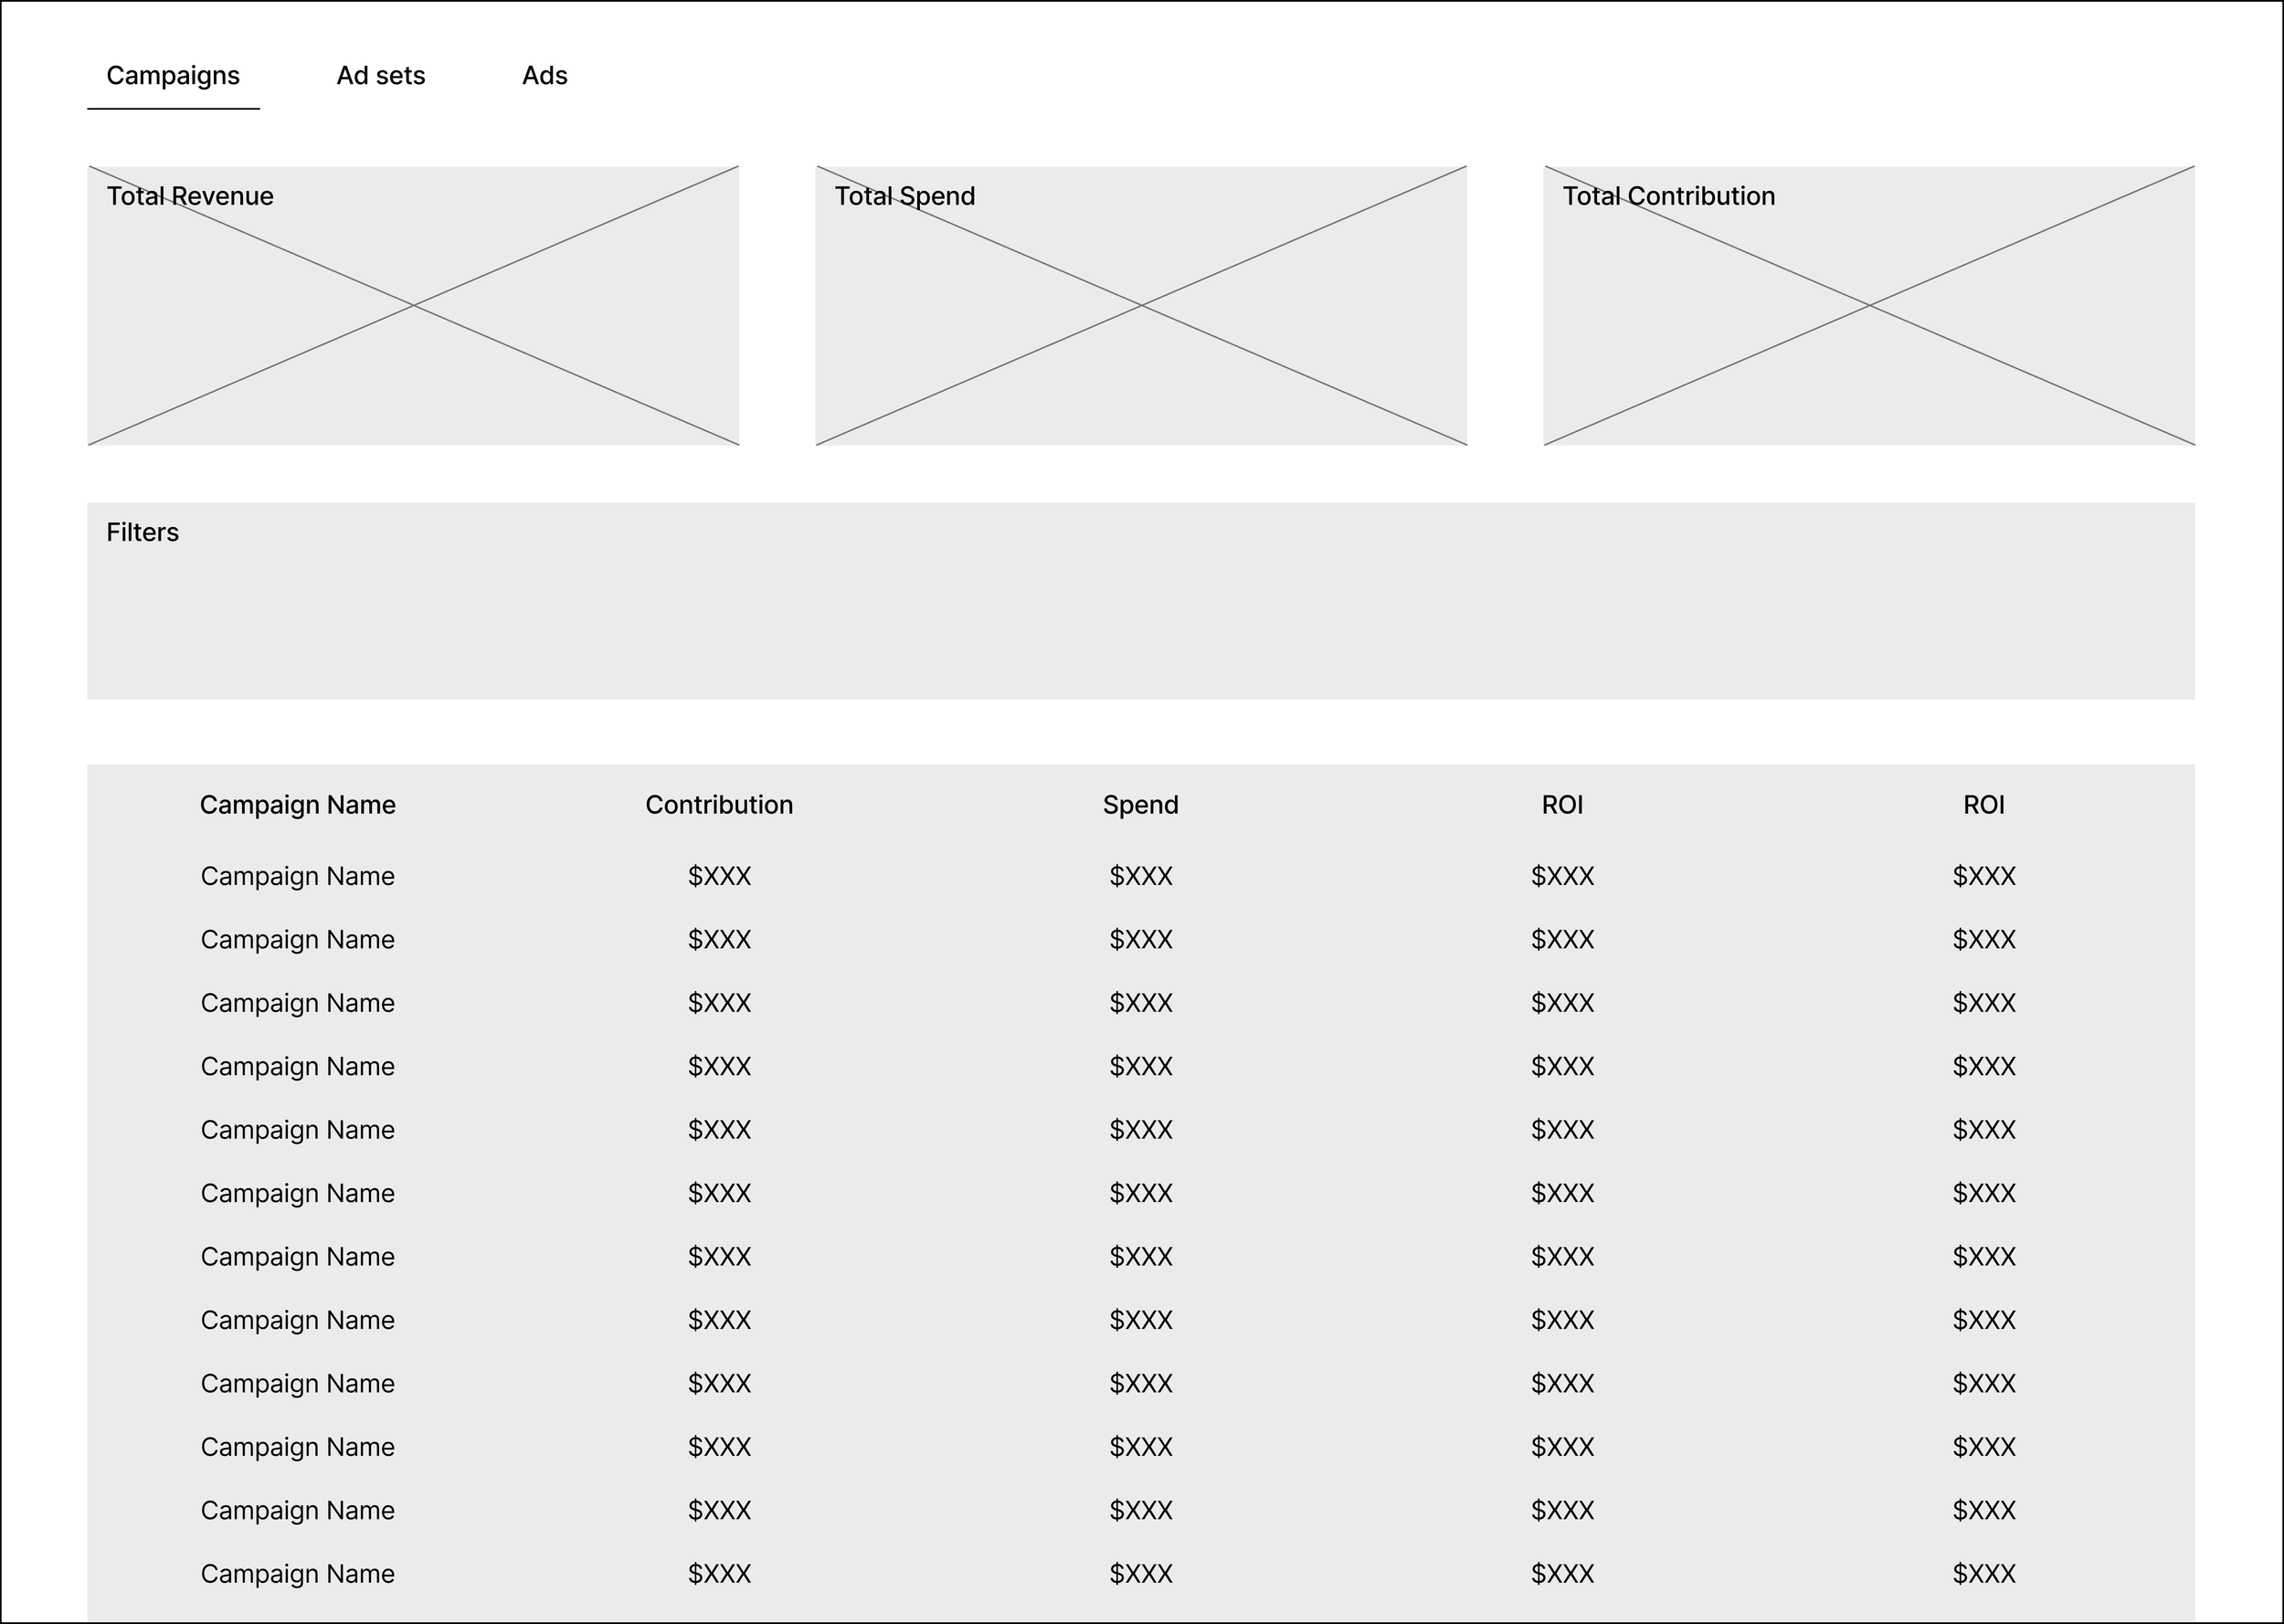
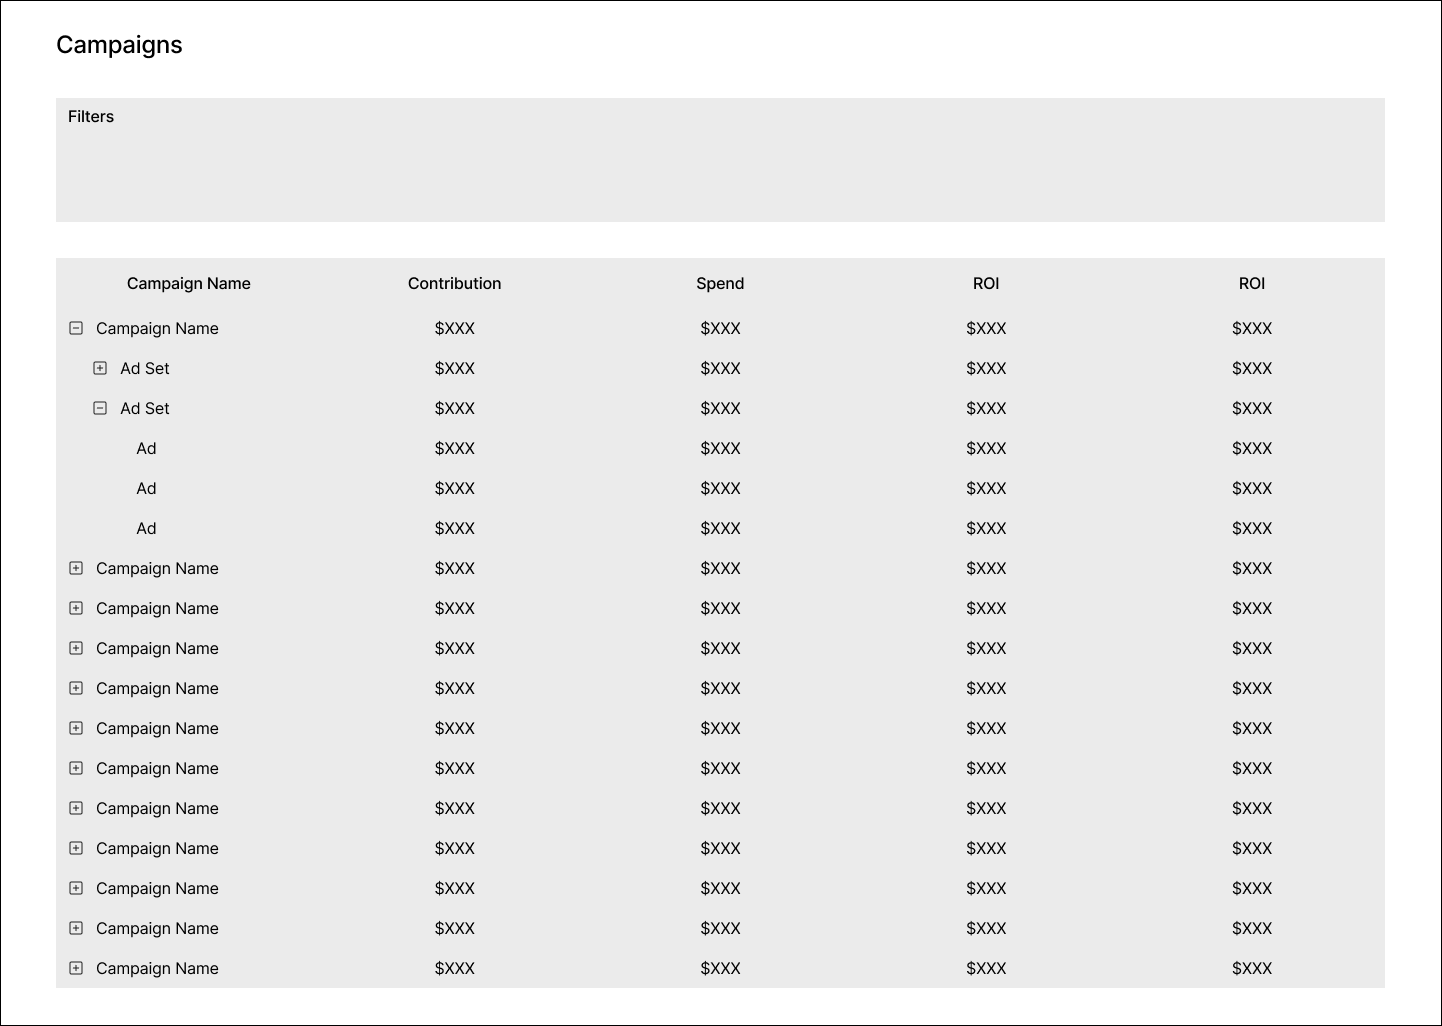
I explored various approaches—single-page dashboards, custom report builders, and stacked or tabbed layouts. I settled on a two-page, stacked design that aligned with marketers’ mental models, while avoiding cognitive and system overload: a dashboard for high-level insights and a reporting view for deeper analysis.
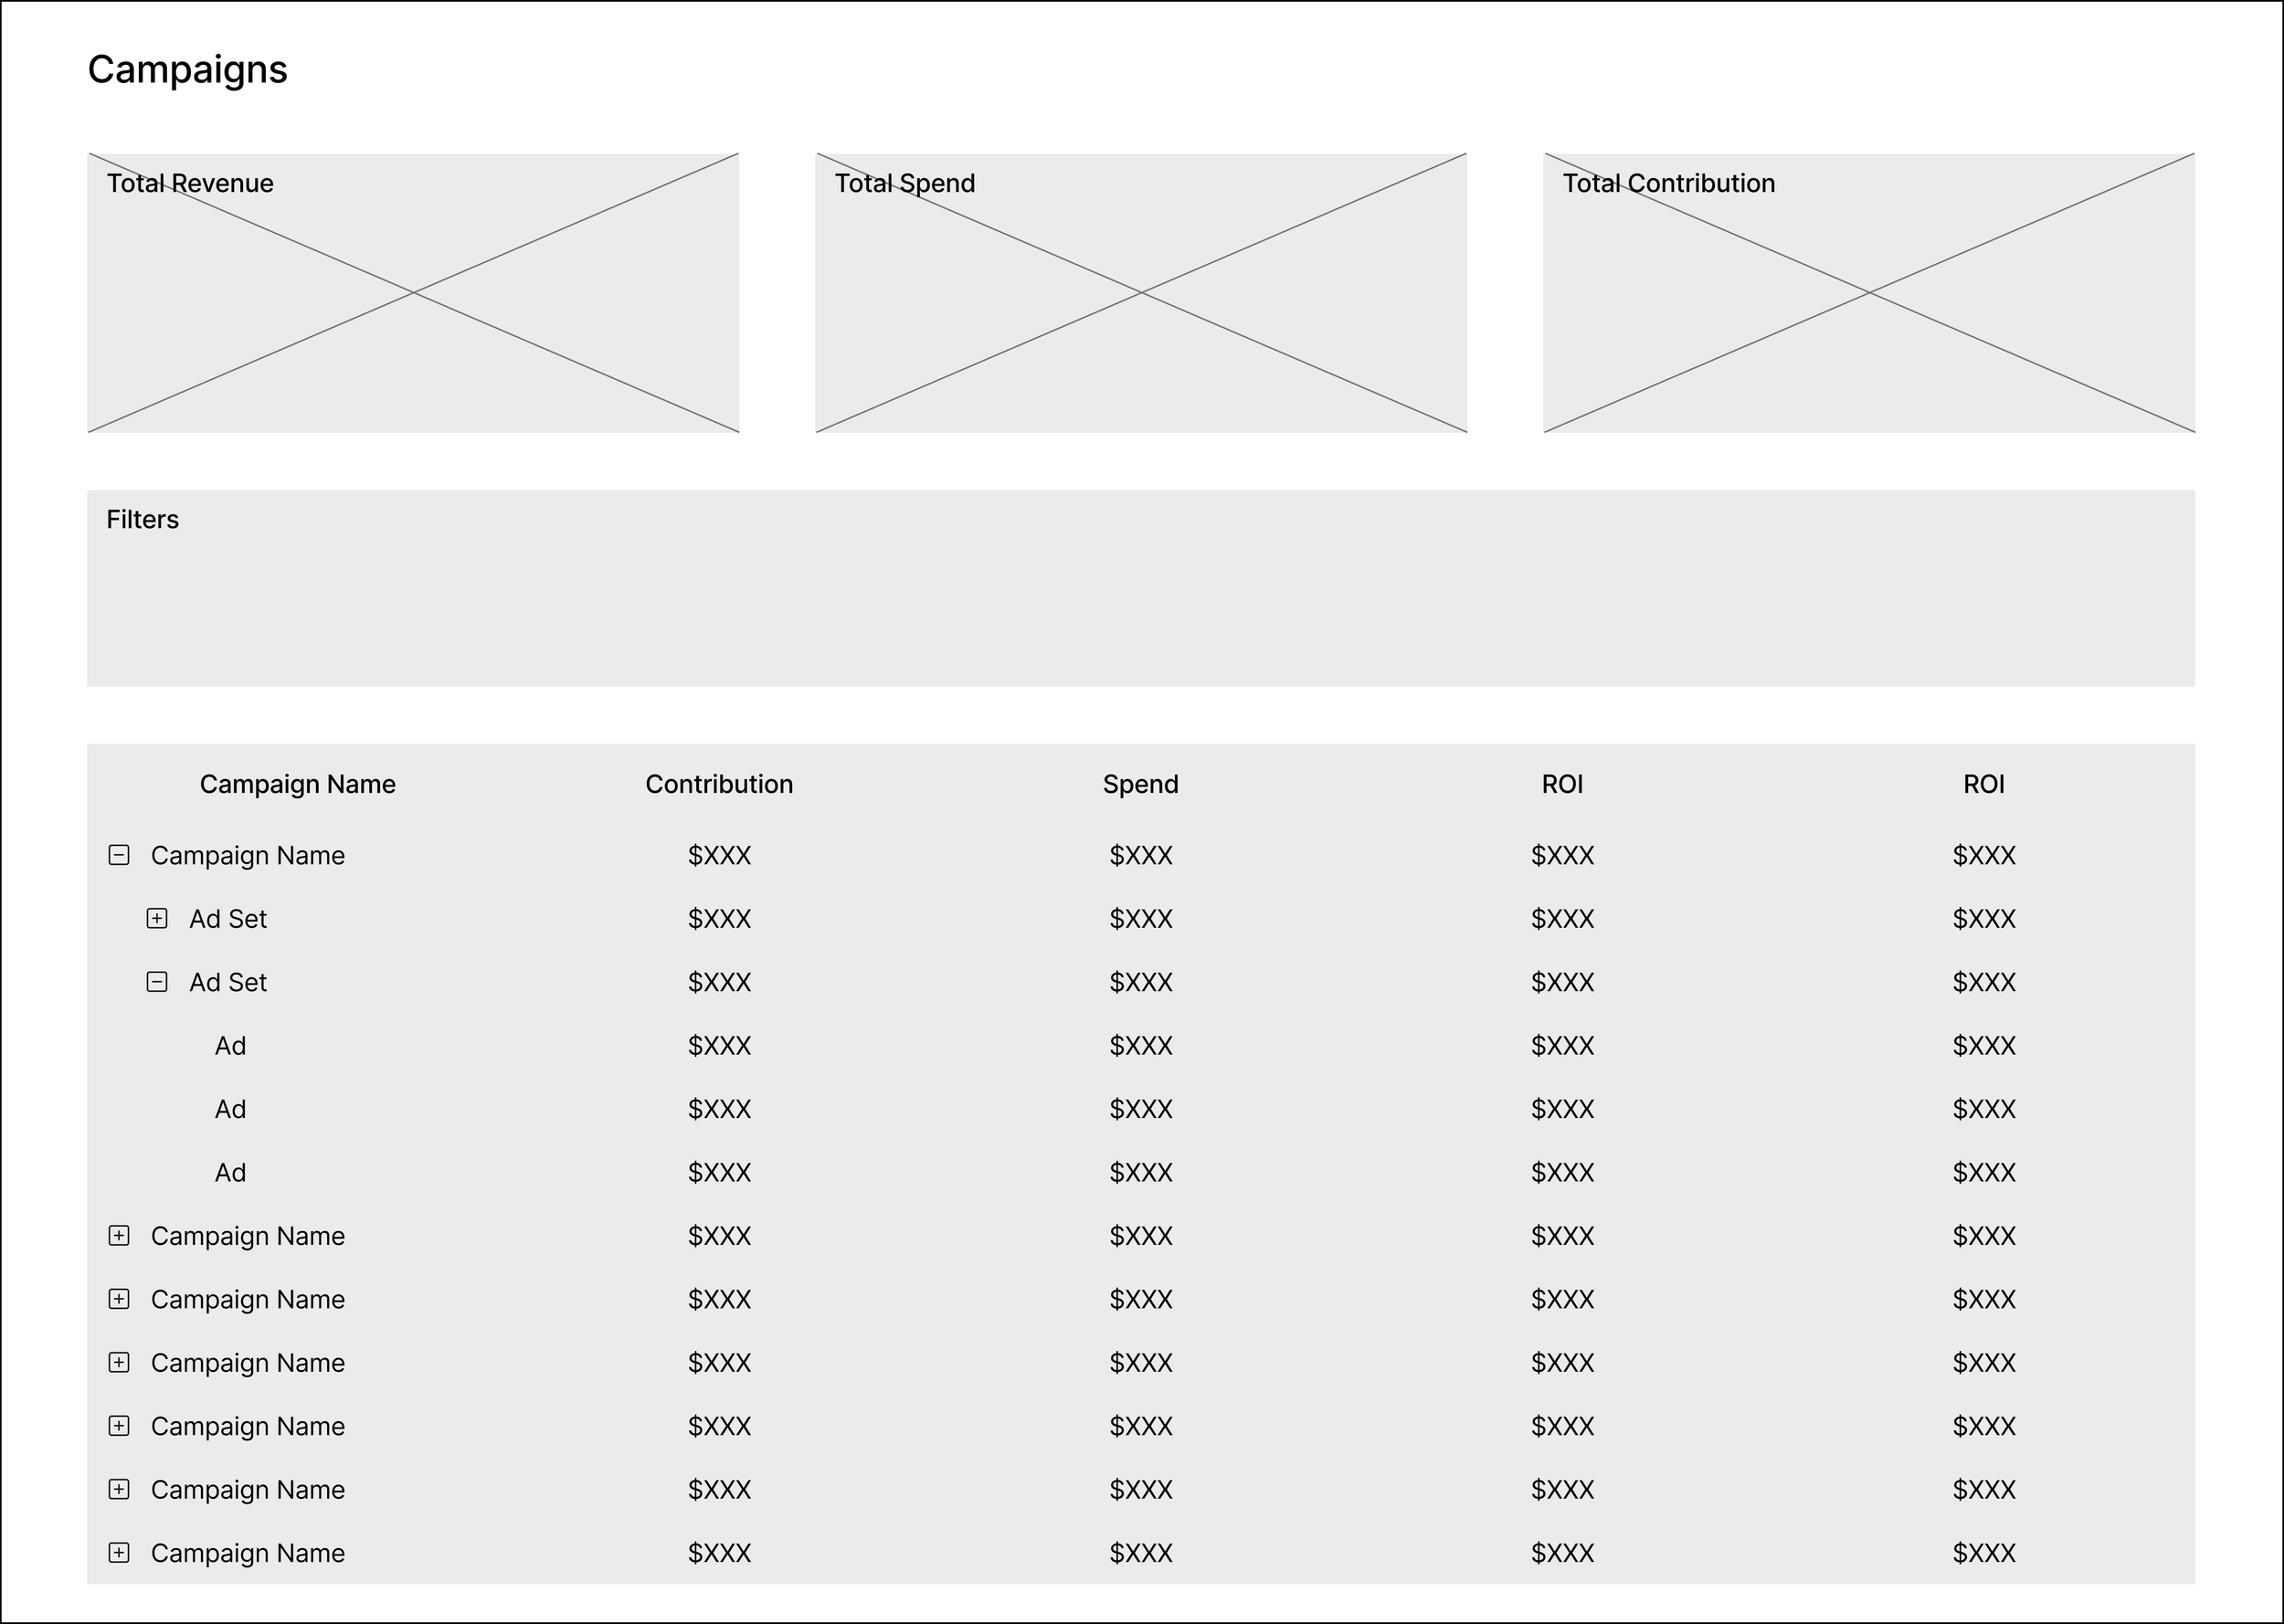
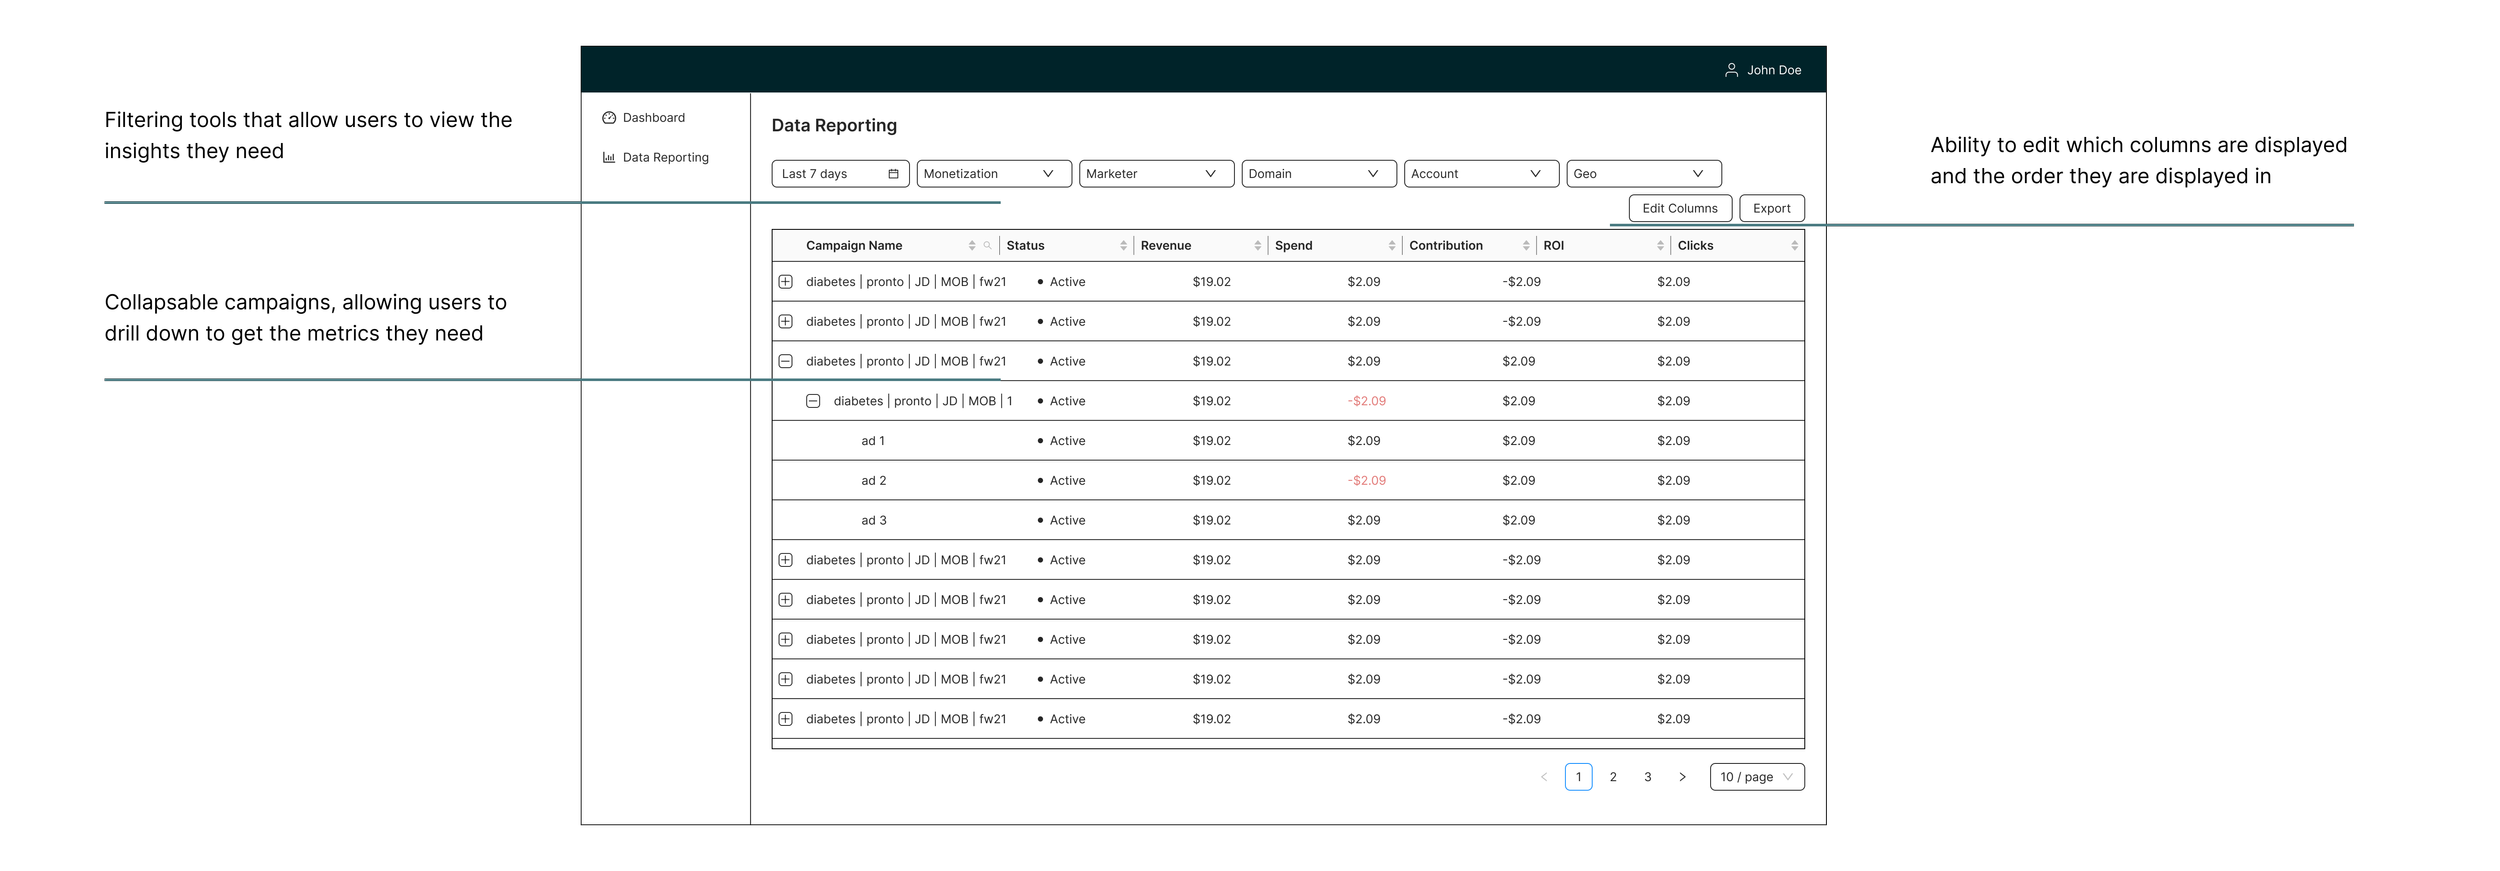
Wireframes
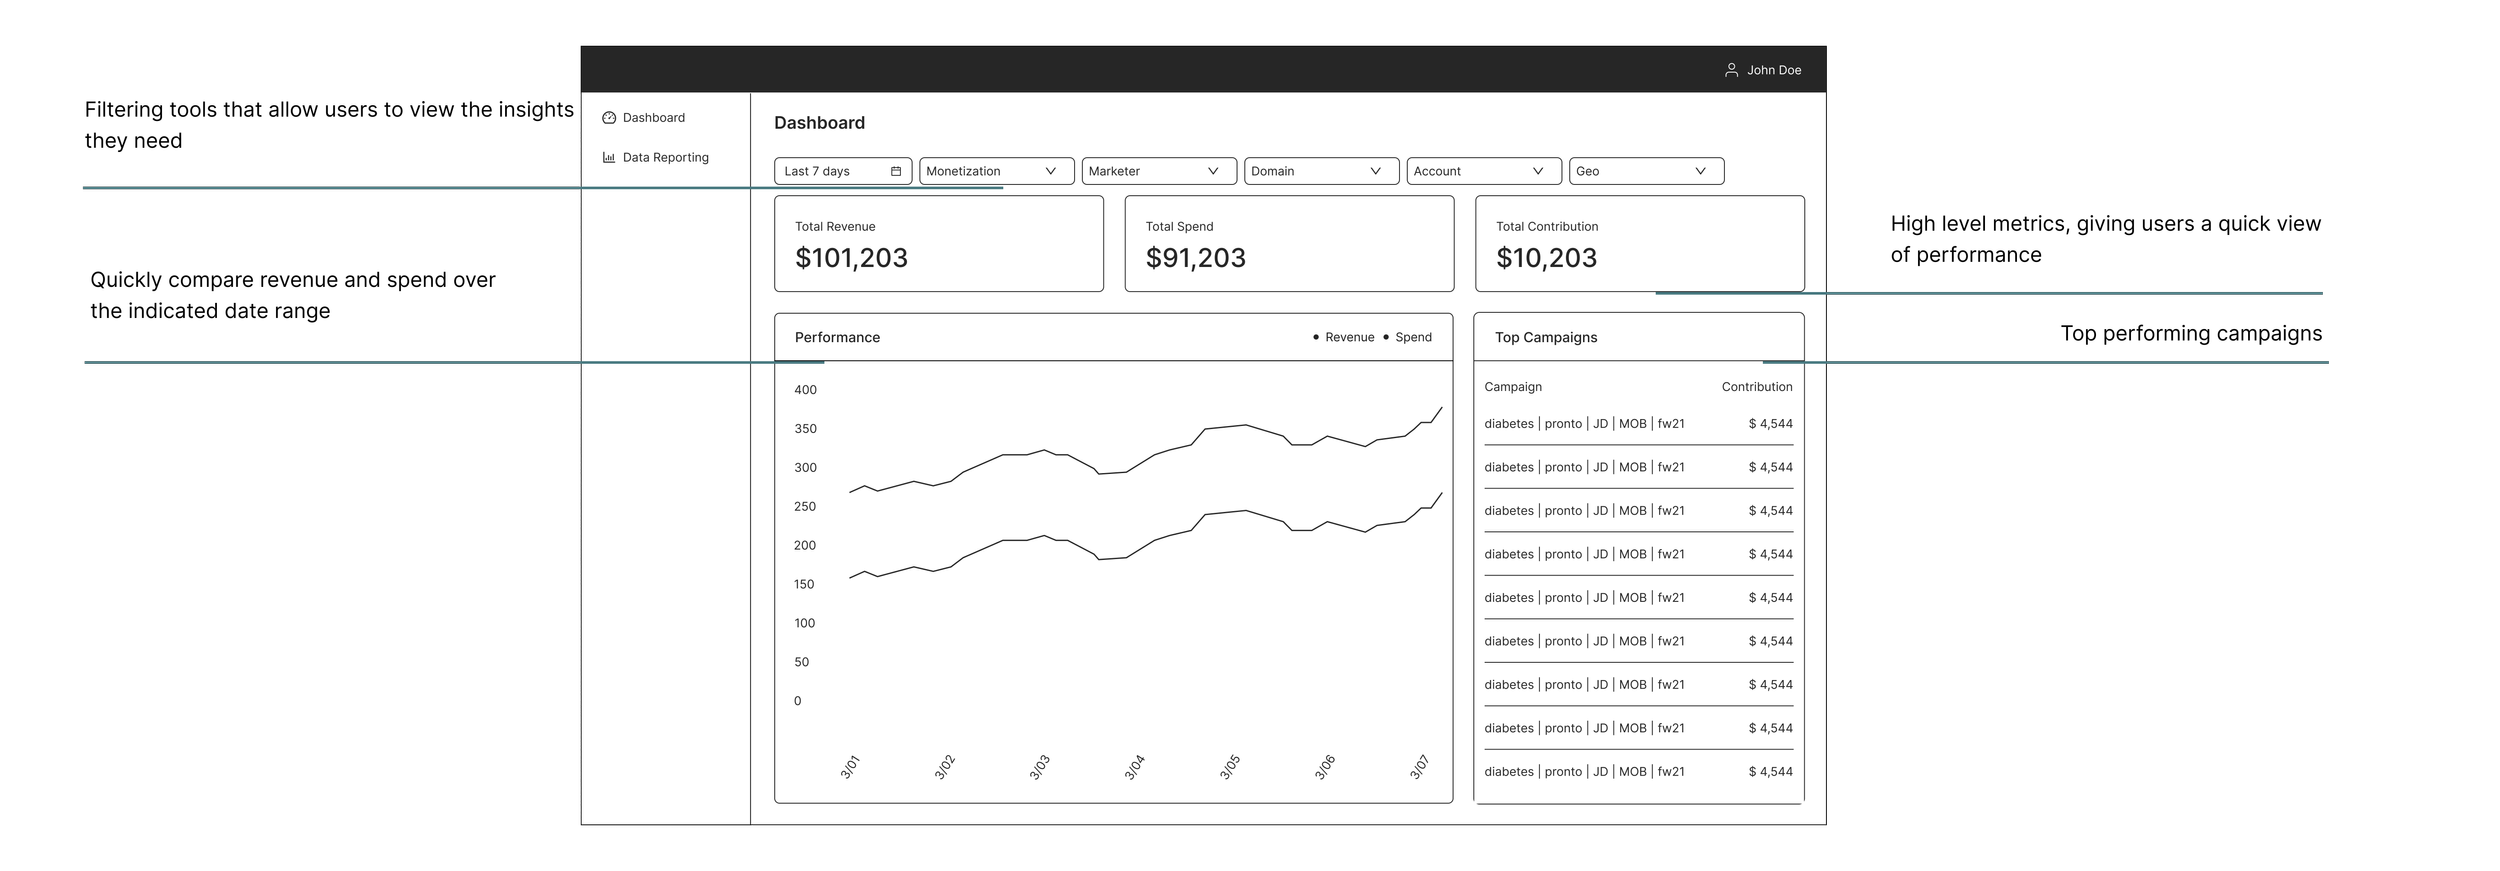
Higher-fidelity wireframes refined the dashboard and reporting views before visual design and engineering handoff.
03 — Testing & Iteration
I met with marketers and marketing managers to review initial designs and gather feedback. Three key pivots emerged:
Finding
Stacked tables made ad set comparison mentally taxing and inefficient.
Change
Implemented a tabbed layout to facilitate seamless, side-by-side performance analysis without losing context.
Finding
Fixed filter sets were too rigid for advanced users who needed to isolate specific subsets of campaign data.
Change
Updated the filtering system to support more filters and eventually support multi-layer logic post-MVP.
Finding
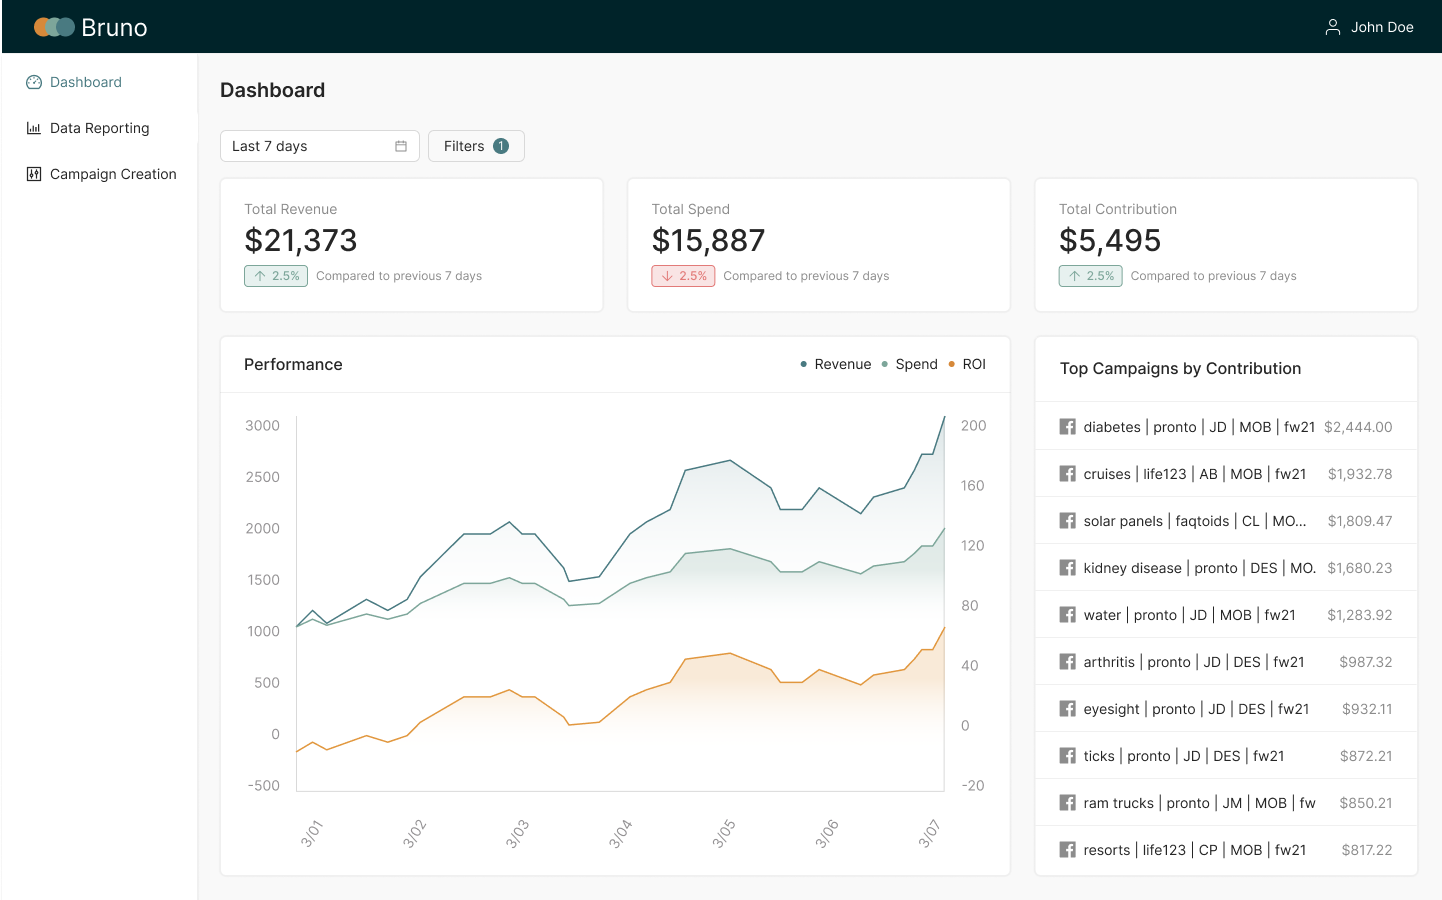
High-level spend and revenue metrics felt abstract without a direct correlation to profitability on the main dashboard.
Change
Integrated ROI into the performance chart to provide immediate, actionable context.
Prototype
The final product combined a high-level dashboard with a deeper reporting view—centralizing buy and sell-side metrics in one place.
04 — Going Forward
After launch, the focus shifted to deepening insight-to-action: richer filtering, and eventually closing the loop with campaign creation and bidding automation.
2 hrs
Daily time reclaimed per marketer
+15%
Portfolio capacity increase
Learnings
Through this project, I developed a deeper understanding of data reporting interfaces. I learned that crafting a comprehensive and useful user experience involves considering various components, such as specific metrics, filters, and date ranges, and ensuring they are presented together in a clear and effective way for a variety of users.
Next Steps
Add campaign creation and bidding automation to further streamline marketers’ workflows and close the loop between insight and action.
Continue enhancing the filtering system with dynamic filters, saved filter sets, and smarter defaults based on user behavior.